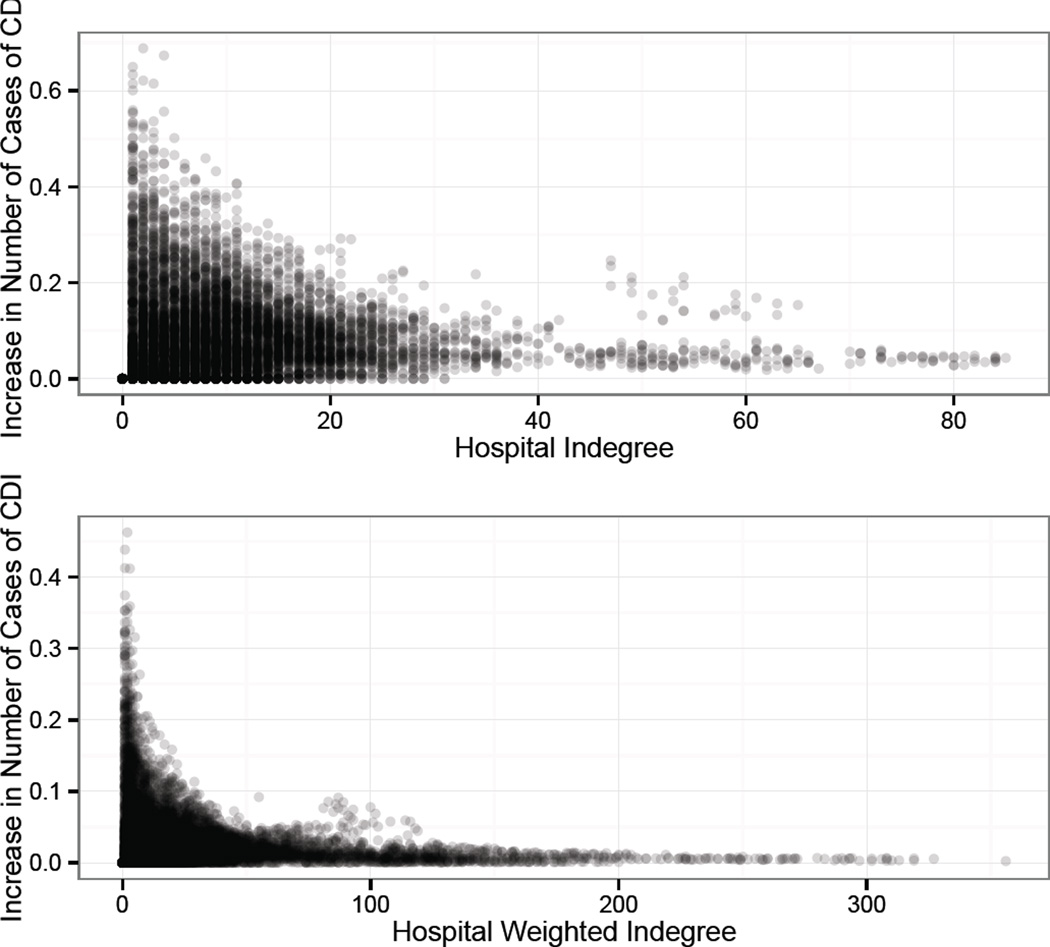
Figure 3.
Increase in expected CDI incidence with a one unit increase in indegree (top) or weighted indegree (bottom), adjusted for the observed hospital characteristics. The x-axis represents the initial indegree/weighted indegree and the y-axis represents the increase in the number of expected cases of CDI per quarter for that hospital. The value is the difference between the predicted number at the starting value of indegree/weighted indegree and the predicted number of cases at 1 plus the starting value.

