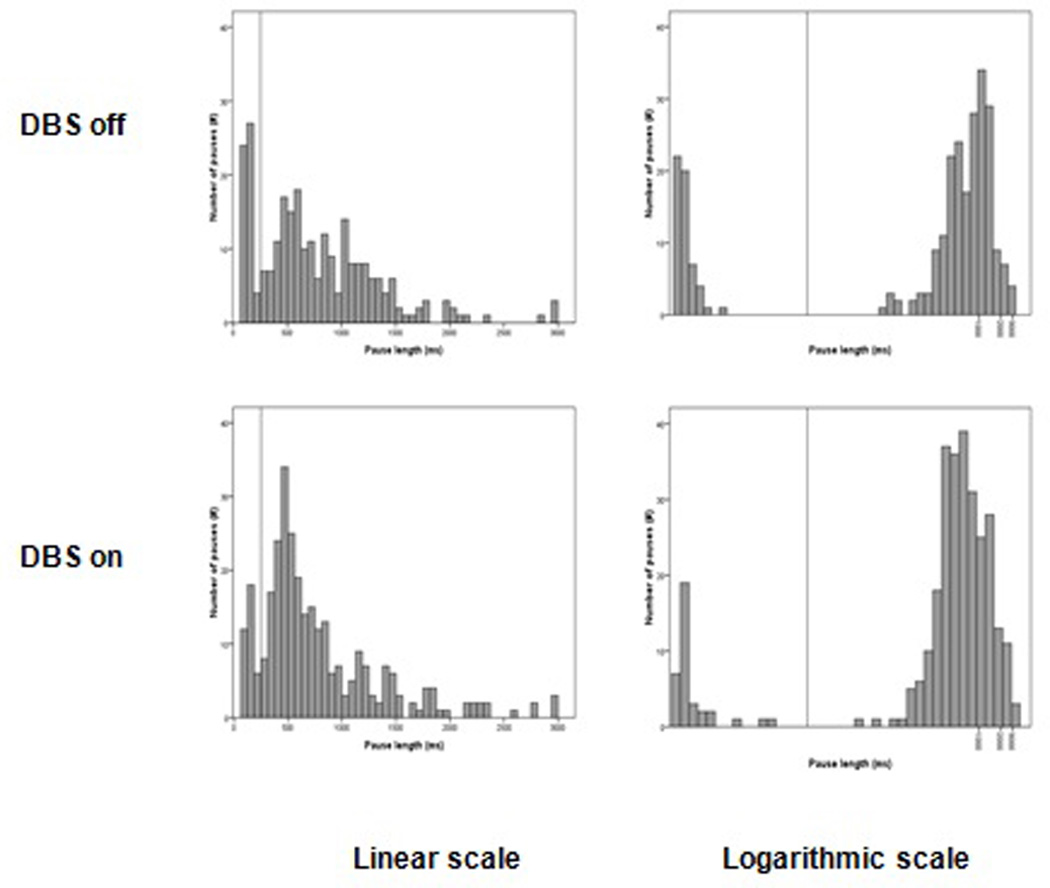
Figure 2.

Distribution of pause length in discourse samples of PD STN-DBS participants during STN-DBS OFF and ON condition. To clearly view the distribution, charts were depicted in linear (left column) and logarithmic scale (right column). Vertical line in each chart indicates 250ms, where the bifurcation of distribution occurs.
