Figure 2.
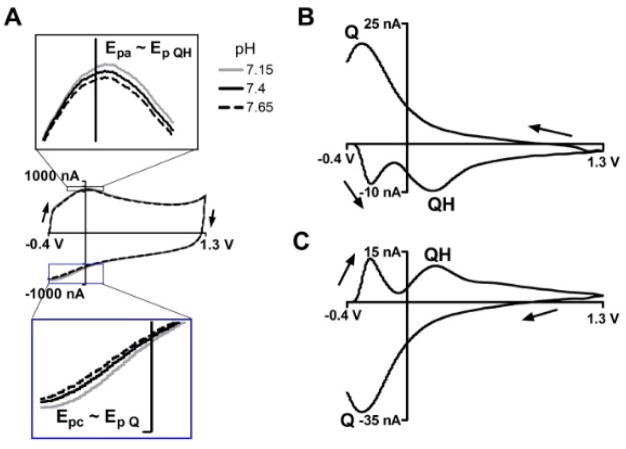
Characteristic FSCV signals in response to pH changes. (A) CVs of the background currents in various pHs, arrows indicate scan direction. Background peak positions, Epa and Epc, and their response to pH are displayed in the top and bottom inset respectively. Epa and Epc, are approximated by background subtracted peak position, Ep QH and Ep Q, as labeled. (B) A background subtracted CV for a basic change (+0.25 pH units) is generated by subtracting the CV at pH 7.4 (A, black line) from pH 7.15 (A, dashed line). (C) An acidic shift (−0.25 pH units) is found by subtracting pH 7.4 (A, black line) from pH 7.65 (A, grey line). QH, Q peaks, and scan direction are labeled.

