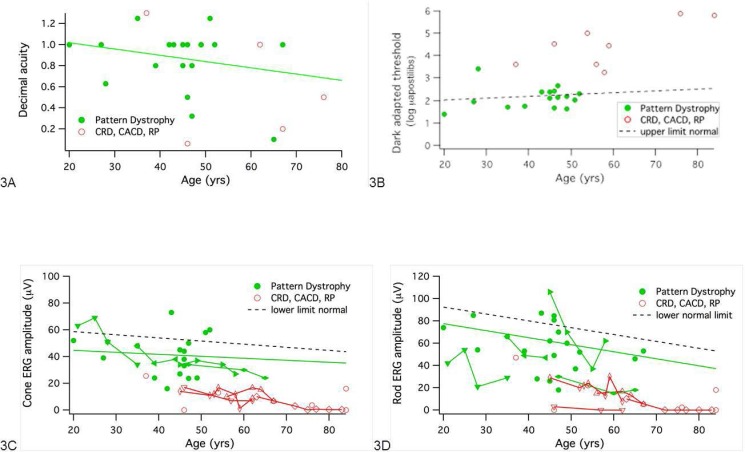
Figure 3.
Visual function in patients with PD (solid green circles; solid regression line) and widespread dystrophy (open red circles). (A) Visual acuity (decimal) as a function of age. (B) Final dark-adapted threshold as a function of age. Dashed line is upper limit of normal. (C) Cone b-wave amplitude to ISCEV standard 30-Hz flicker. Lines connect repeated measurements in a patient. Solid regression is linear fit to amplitudes for PD. Dashed line is lower limit of normal (P < 0.05). (D) Rod b-wave amplitude to ISCEV standard flash. Lines connect repeated measurements in a patient. Solid regression is linear fit to amplitudes for PD. Dashed line is lower limit of normal (P < 0.05).

