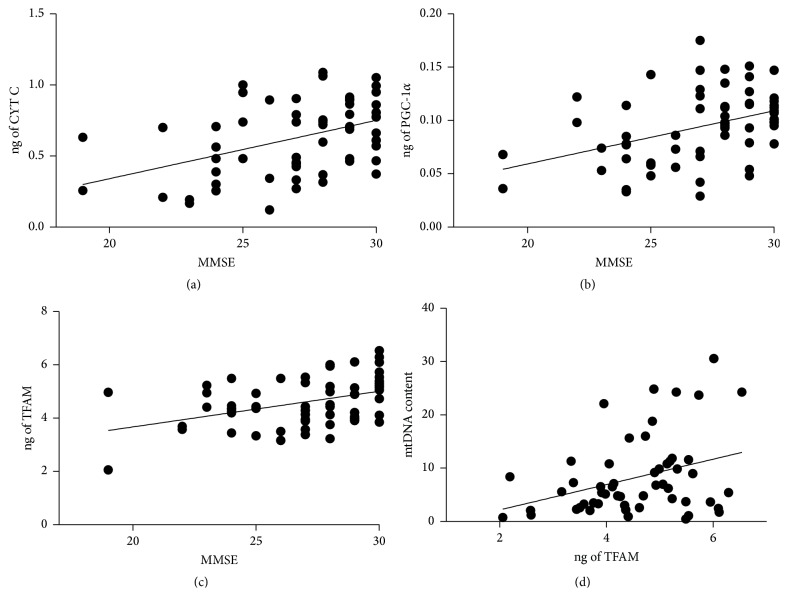
Figure 6.
Correlation between CYT C, PGC-1α, or TFAM proteins with cognitive decline. The values of CYT C (a), PGC-1α (b), or TFAM (c) in protein extracts derived from PBMCs were correlated with the corresponding values of MMSE score. ng of CYT C/MMSE, r 2 = 0.189, p = 0.0006; ng of PGC-1α/MMSE, r 2 = 0.171, p = 0.0008; ng of TFAM/MMSE, r 2 = 0.175, p = 0.0009. (d) The values of TFAM were also correlated with the corresponding values of mtDNA content (r 2 = 0.117, p = 0.01).

