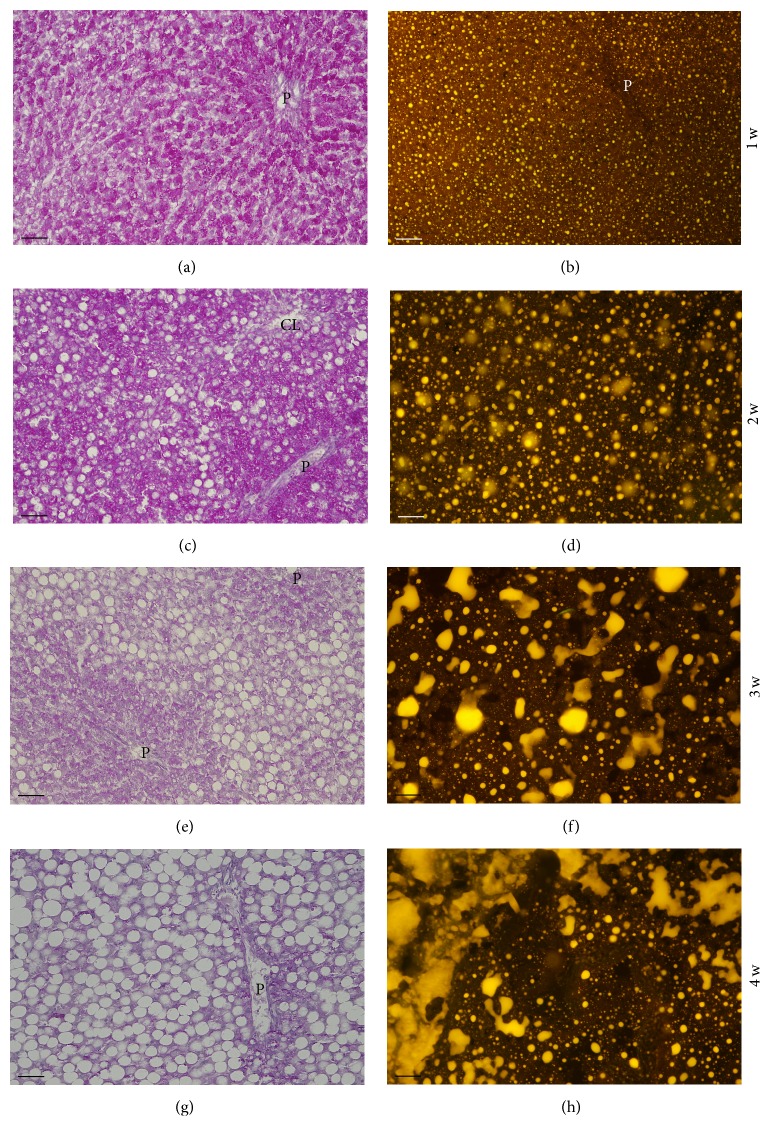
Figure 2.
Comparison between glycogen accumulation (PAS reaction; (a), (c), (e), and (g)) and neutral lipid accumulation (Nile Red reaction; (b), (d), (f), and (h)) in the liver of rats fed with the MCD diet for 1–4 weeks. Representative photomicrographs. It is shown that whereas the glycogen content of the liver sharply decreases in the 2nd week of the diet and vanishes altogether in the 3rd and 4th weeks, the neutral lipid content dramatically increases from the 2nd to the 4th week. P: branch of portal vein; CL: branch of centrolobular vein. Scale bar: 50 μm.

