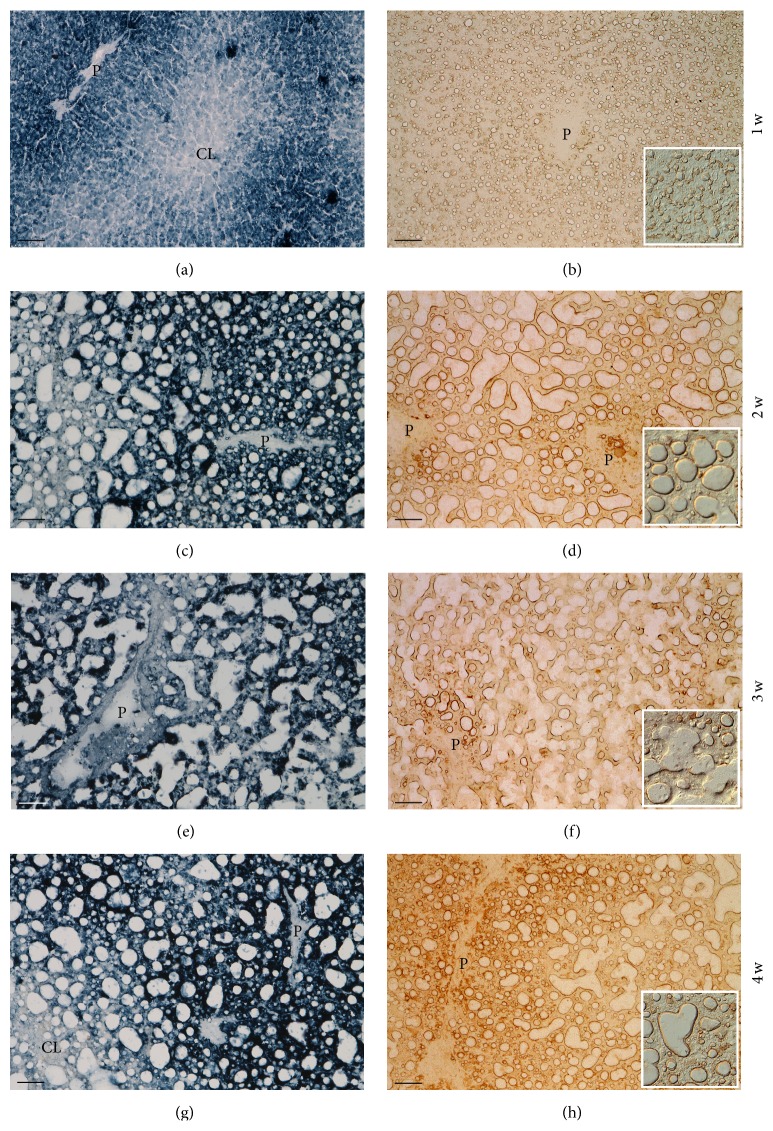
Figure 3.
Comparison between ROS formation (DAB-Mn-Co reaction; (a), (c), (e), and (g)) and carbonyl groups derivatized with DNPH (immunoreaction against DNP; (b), (d), (f), and (h)) in the liver of rats fed with the MCD diet for 1–4 weeks. Representative photomicrographs. Whereas in the 1st week of the diet the lobular ROS pattern is similar to the control liver, from the 2nd week onwards, ROS formation is intense in all hepatocytes, being concentrated in the cytoplasm surrounding large lipid droplets. The patterns of peroxidized proteins follow the ROS trend. P: branch of portal vein; CL: branch of centrolobular vein. Scale bar: 50 μm (insets: details at higher magnification).

