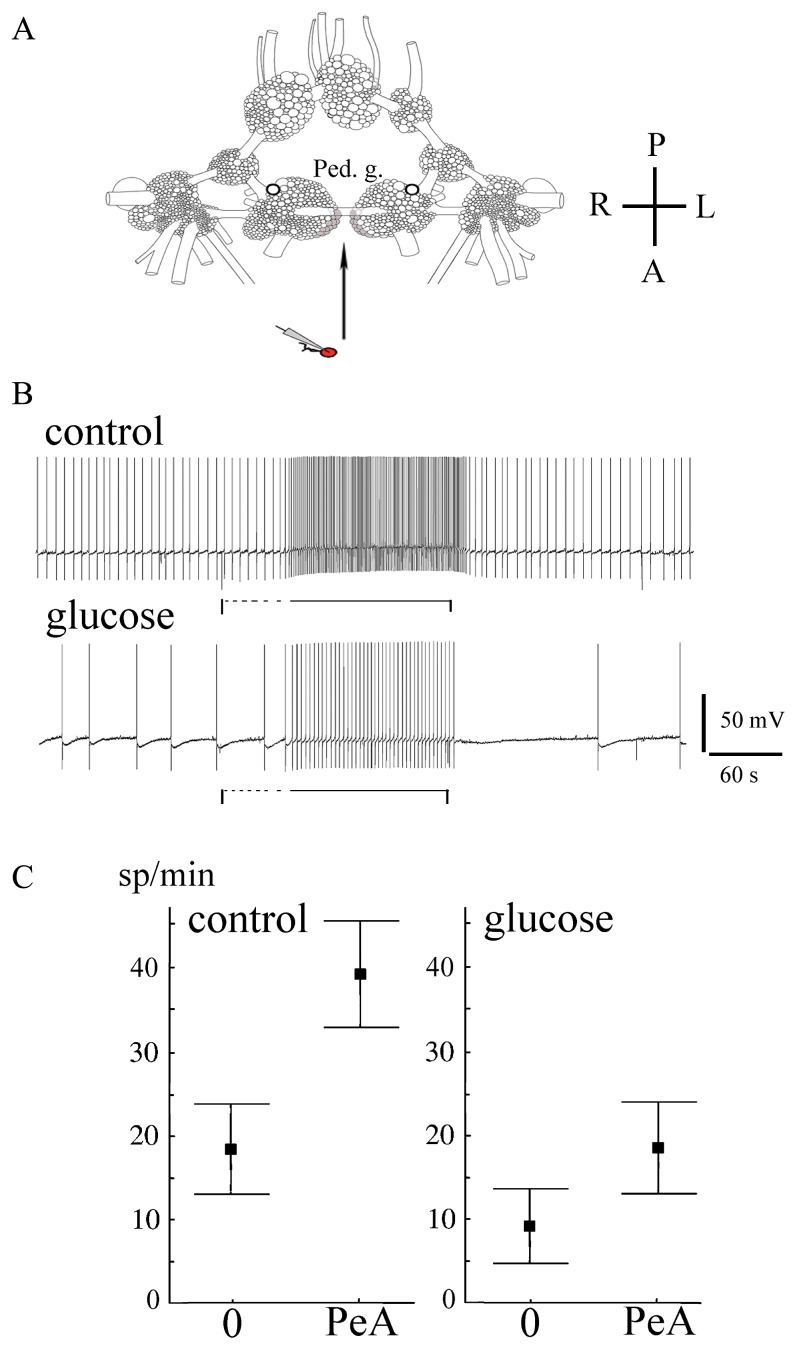
Figure 2.
Effects of glucose on the activity of isolated PeA neurons and their responses to the nearby PeA cluster of pedal ganglia. A. A schematic representation of the experimental procedure: the isolated neuron impaled with the microelectrode was placed at a distance from the pedal ganglia of an isolated CNS then moved to the pedal A cluster (shaded) at a distance less than half-cell size for 2 minutes and replaced. A, anterior; P, posterior; L, left; R, right. B. The response of isolated serotonergic PeA neurons to the nearby pedal A cluster prior to (upper record) and 7 minutes after (lower record) bath application of glucose. The vertical lines mark the start of biosensor movement, the horizontal dashed lines mark the movement of the biosensor to the PeA cluster, and the horizontal black lines mark the unmovable state of the biosensor near the PeA cluster. C. The activity of isolated serotonergic PeA neurons (mean with standard error), left to right: prior to glucose treatment away from the pedal ganglia (0) and near the PeA cluster (PeA), 7 minutes after glucose bath application away from the pedal ganglia (0) and near the PeA cluster (PeA). Other statistical data are in the text.

