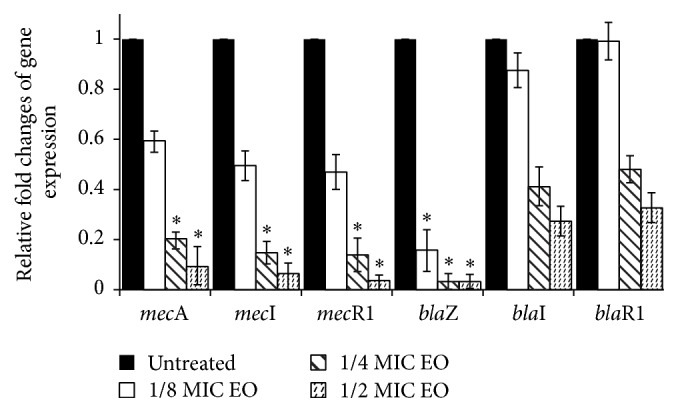
Figure 4.

Relative expression of genes of mec and bla operons. S. epidermidis R8 was treated with subinhibitory concentrations of EO from S. sclarea for 30 min. Transcript levels were monitored by real-time PCR as described in the text. Using the 2−ΔΔCt method, the data are presented as the fold change in gene expression normalized to an endogenous reference gene (GAPDH) and relative to the untreated control (value 1). Values represent the mean ± SD for three independent experiments. ∗ P < 0.05.
