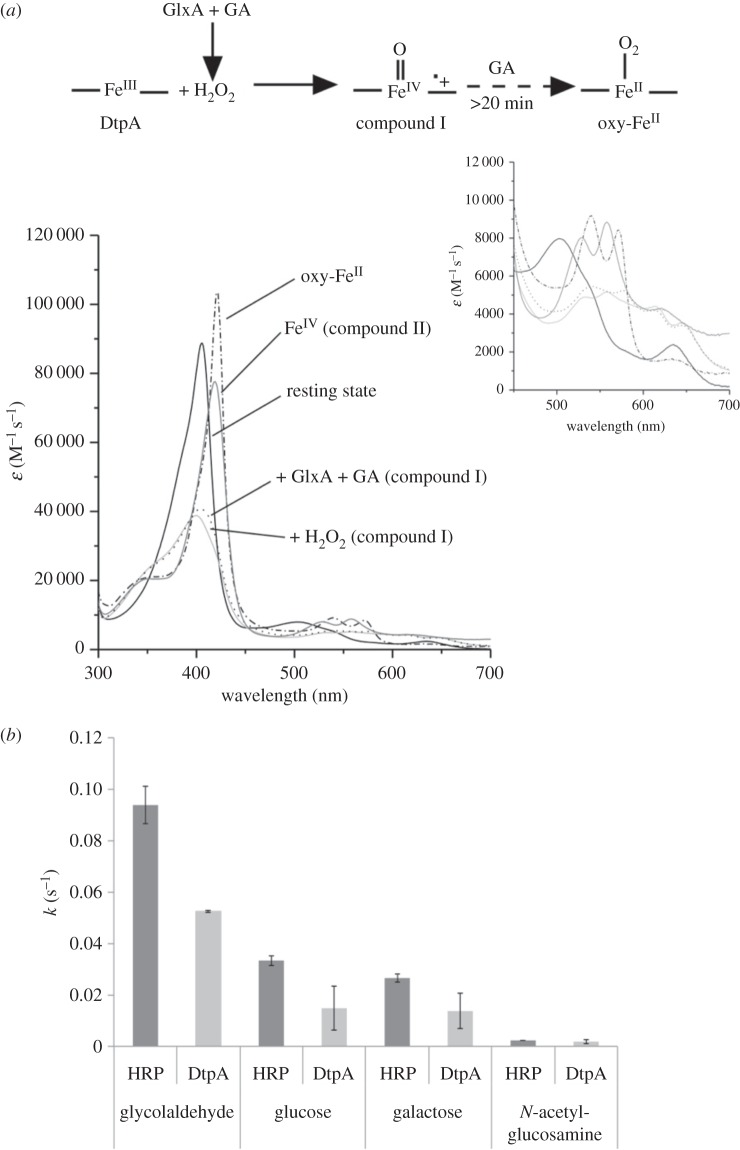
Figure 5.
Peroxidase activity of DtpA. (a) Static UV–visible spectra of various haem oxidation states of DtpA (20 mM sodium phosphate pH 7, 100 mM NaCl) as illustrated by the reaction scheme. Addition of H2O2 (light-grey solid line), or addition of GlxA and glycolaldehyde (GA) (dotted line) to resting state (FeIII) DtpA leads to a compound I spectrum (formed within approx. 1 min). Over time (more than 20 min) the compound I species is converted to a species with an oxy-ferrous like spectrum (dashed-dotted line) in the presence of GA. Note that no compound II species is observed in this process. The compound II spectrum shown was generated by formation of DtpA compound I followed by addition of [Fe(CN)6]4− (dark grey solid line). The inset shows a zoomed-in region of the weaker intensity absorbance bands. (b) Turnover rates (k) for GlxA with four different substrates (30°C) in the presence of HRP or DtpA determined through the subsequent oxidation of ABTS. Error bars indicate the standard deviation from triplicate experiments.

