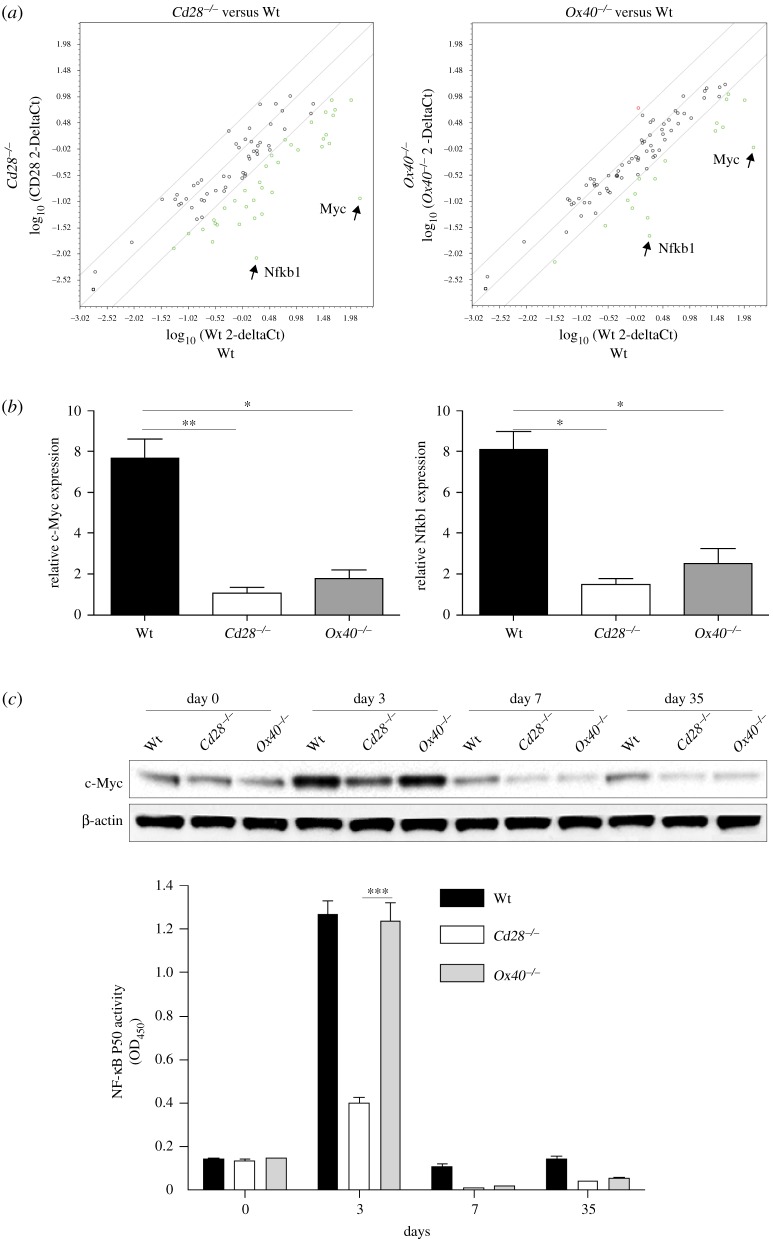
Figure 2.
Transcription of c-Myc and Nfkb1 is reduced in Cd28−/− or Ox40−/− memory CD8+ T cells. Naive Thy1.2 CD8+ TCRVβ5+ T cells from OT-I, OT-I/Cd28−/− or OT-I/Ox40−/− mice were adoptively transferred into Thy1.1 congenic mice infected i.p. with VV-OVA. At day 35, approximately 1 × 10⁶ Thy 1.2+ memory T cells from the spleen and LNs were sorted. (a) The scatter plots of PCR array. Total RNA (1 µg) was isolated for the RT2 Profiler PCR Array. Pairwise comparison of Wt and Cd28−/− or Ox40−/− by scatter plot analysis. Spots associated with individual transcription factor genes were collected and converted into a log10 scale. The central line indicates unchanged gene expression. The dots are allocated to positions that are above or below than the +3 fold or −3 fold line when the differences are greater than threefolds. Data are representative of three independent experiments. (b) Relative expression of c-Myc and Nfkb1 by RT-PCR. Data are represented as the mean ± s.e.m. from three independent experiments (*p < 0.05, **p < 0.01. One-way ANOVA). (c) Protein expression of c-Myc and canonical NF-κB activity detected by immunoblot or p50 ELISA. Similar data were obtained in three experiments (***p < 0.001; two-way ANOVA). In Western blots, β-actin was used as internal control. For Western blots belonging to the same experiment, bands pertaining to different proteins were cropped from the same blot.

