Figure 3.
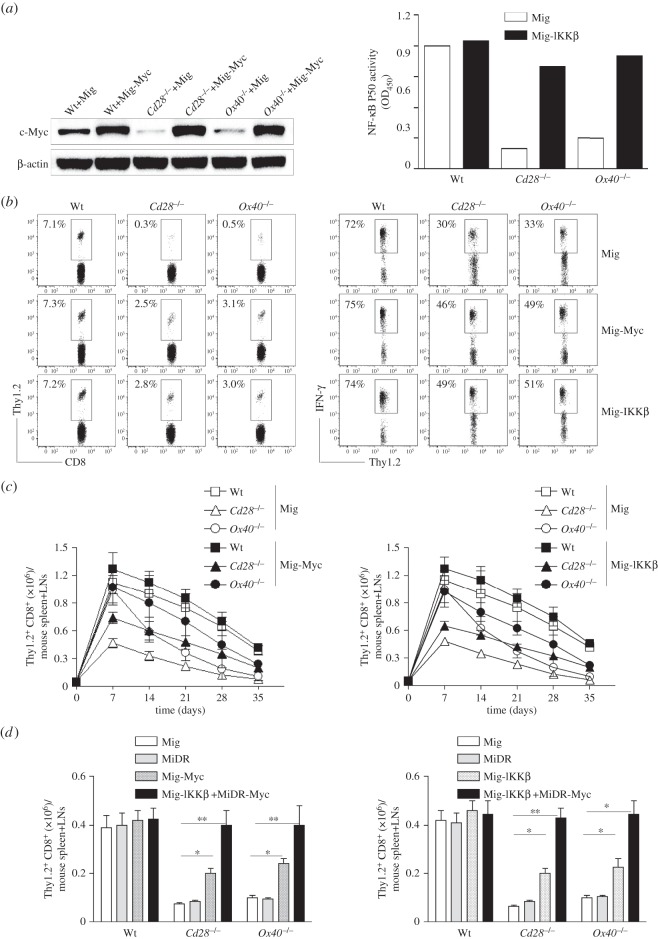
Over-expression of c-Myc or IKKβ substantially reverses the defective generation of Cd28−/− or Ox40−/− memory CD8+ T cells during an interrogation of primary response. Naive Thy1.2 CD8+ TCRVβ5+ T cells from OT-I, OT-I/Cd28−/− or OT-I/Ox40−/− mice were stimulated with peptide and APCs. On day 2/3, T cells were transduced with retroviral vectors expressing GFP alone (Mig), GFP with c-Myc (Mig-Myc), GFP with CA-IKKβ (Mig-IKKβ) or DsRed with c-Myc (MiDR-Myc) plus Mig-IKKβ. On day 5 of primary culture, 5 × 10⁴ GFP+ or GFP+ DsRed+ CD8 cells were sorted and adoptively transferred into Thy1.1 congenic mice that were infected i.p. with VV-OVA on the following day. After various days, the transferred T cells from the spleen and LNs were analysed. Five mice were used for each time point. (a) C-Myc or ΙKKβ transduction. On day 5 of primary culture, GFP+ T cells were sorted and analysed for c-Myc and β-actin or canonical NF-κB activity by immunoblot or p50 ELISA. Similar data were obtained in three experiments (p < 0.001 between Mig and Mig-IKKβ in Cd28−/− or Ox40−/−; two-way ANOVA). In Western blots, β-actin was used as internal control. For Western blots belonging to the same experiment, bands pertaining to different proteins were cropped from the same blot. (b) The frequencies of Thy1.2+ T cells at day 35 post-infection of VV-OVA, gating on CD8+ cells (left). At day 35 post-infection of VV-OVA, splenocytes were stimulated with OVA peptide for intracellular IFN-γ staining, gating on Thy1.2+ cells (right). Data are representative of three independent experiments (p < 0.001 between Wt and Cd28−/− or Ox40−/− with Mig; p < 0.01 between Wt and Cd28−/− or Ox40−/− with Mig-Myc or Mig-IKKβ both left and right panels; p < 0.001 between Mig and Mig-Myc or Mig-IKKβ in Cd28−/− or Ox40−/−; p < 0.05 between Mig and Mig-Myc or Mig-IKKβ in Cd28−/− or Ox40−/− both left and right panels; two-way ANOVA). (c) Numbers of CD8+ Thy1.2+ T cells at indicated day post-infection of VV-OVA. Data are represented as the mean ± s.e.m. (p < 0.01 between Mig and Mig-Myc in Ox40−/− on days 14 and 21; p < 0.05 between Mig and Mig-IKKβ in Ox40−/− on days 14, 21 and 28; two-way ANOVA). (d) Numbers of CD8+ Thy1.2+ T cells at day 35 post-infection of VV-OVA. Data are represented as the mean ± s.e.m. from three independent experiments (*p < 0.05, **p < 0.01; two-way ANOVA).

