Figure 4.
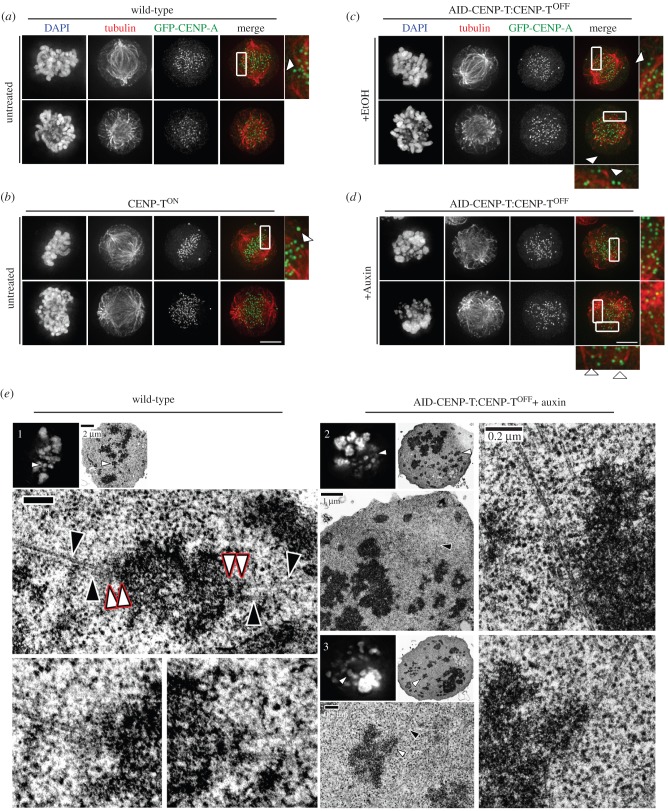
CENP-T loss leads to microtubule attachment defects. GFP-CENP-A was transfected into (a) wild-type, (b) CENP-TON/OFF conditional knockouts and (c,d) AID-CENP-T:CENP-TON/OFF cells. Attachment to PLL-coated coverslips was followed by fixation and staining using antibodies against tubulin. DAPI depicts DNA staining. Scale bar: 5 µm. AID-CENP-T:CENP-TOFF cells were either cultured with (c) ethanol (+EtOH) or (d) auxin (+auxin) for 6.5 h. (e) (1) Light microscopy image (DAPI; left) of a wild-type metaphase cell subsequently processed for thin-section transmission electron microscopy (TEM; right). White arrows depict a metaphase aligned chromosome, with lower panels displaying magnified electron micrographs of the chromosome of interest. In these images red rimmed arrows highlight inner and outer kinetochore plates, while black arrows signify microtubules. (2) Mild and (3) severe phenotypes associated with rapid AID-CENP-T degradation. AID-CENP-T cells were treated with auxin for 6.5 h before immediate processing for electron microscopy. Cells analysed by light microscopy (DAPI; left) and TEM (right) are depicted. White arrows mark the chromosome of interest. Magnified EM images show sites of potential lateral microtubule interactions. Black arrows depict microtubules, while white arrows show possible interactions with chromosomes. Scale bars as indicated.

