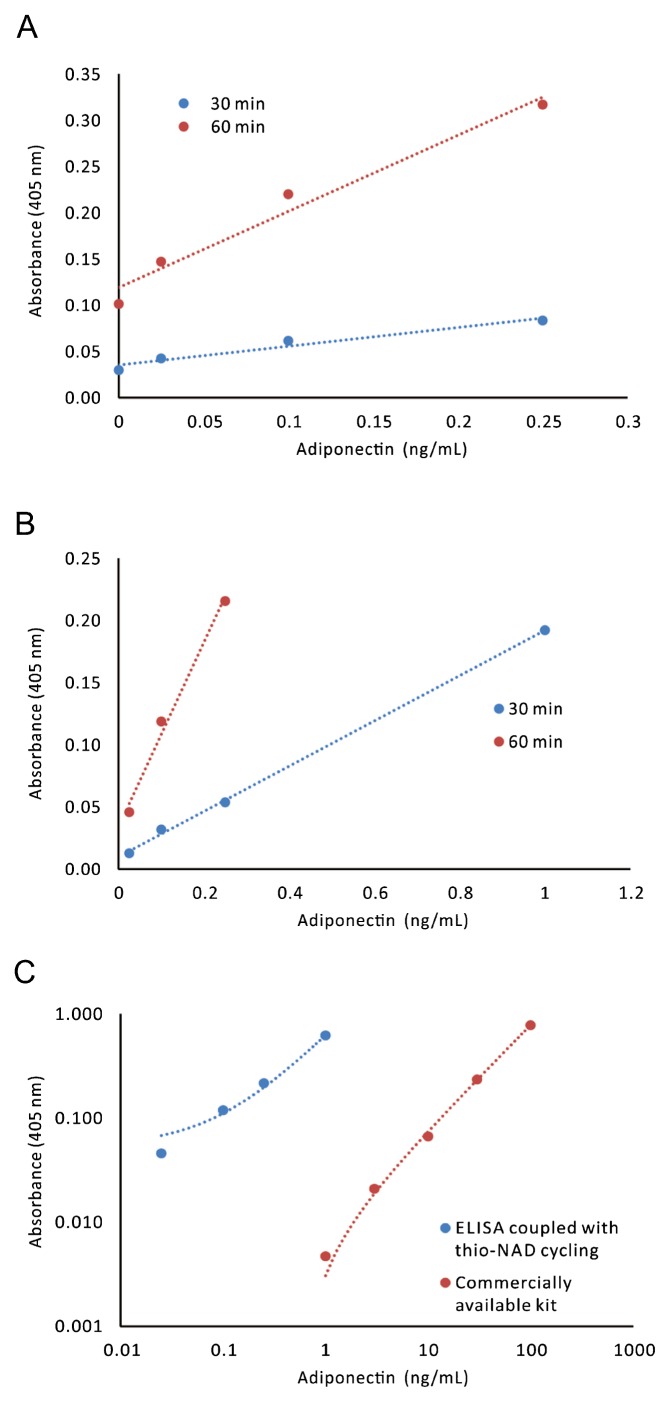
Figure 2.
Linear calibration curves for adiponectin obtained by an ultrasensitive ELISA coupled with thio-NAD cycling. (A) The linear calibration curves including the blank values (i.e., the absorbance of 0 ng/mL of adiponectin) were obtained, because these curves were needed to calculate the limit of detection and the limit of determination. The absorbance of thio-NADH was measured at 405 nm after a cycling reaction time of 30 min (blue) or 60 min (red). These curves are expressed as y=0.20x+0.04, R2=0.95 in the range of 0.025–1.0 ng/mL for 30-min measurement and y=0.82x+0.12, R2=0.97 in the range of 0.025–0.25 ng/mL for 60-min measurement. (B) Typical linear calibration curves in which the blank values (i.e., the absorbance of 0 ng/mL of adiponectin) were subtracted are shown. That is, this figure directly expresses the values corresponding to the concentrations of adiponectin. The linear calibration curve after a cycling reaction time of 30 min (blue) was y=0.18x+0.01, R2=1.00 in the range of 0.025–1.0 ng/mL; and that after a cycling reaction time of 60 min (red) was y=0.74x+0.034, R2=0.99 in the range of 0.025–0.25 ng/mL. (C) Comparison of linear calibration curves between our ultrasensitive ELISA and a commercially available kit. The kit used was the human HMW adiponectin/Acrp30 quantikine ELISA kit (Cat #. DHWAD0; R&D Systems). The linear calibration curve of our ultrasensitive ELISA (blue) was y=0.57x+0.05, R2=1.00 in the range of 0.025–1.0 ng/mL; whereas that obtained from a commercially available kit (red) was y=0.0079x–0.005, R2=1.00 in the range of 1.0–100 ng/mL. Our data (blue) were found to be at least 2 orders of magnitude more sensitive than the commercially available kit (red).

