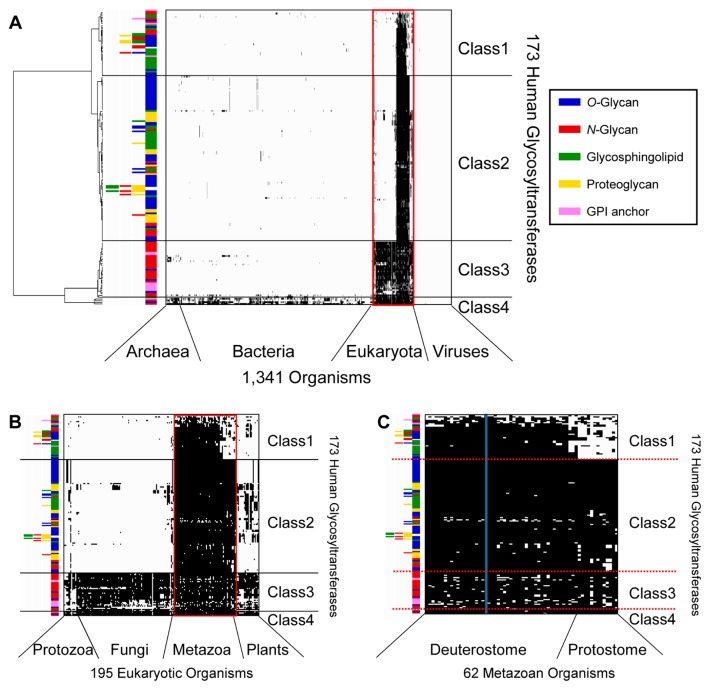
Figure 1.
Clustering analysis of 173 human GTs and functionally linked glycan synthetic enzymes using Ward’s method based on the Manhattan distance. (A) Clustering analysis based on the phylogenetic profiles of 1,341 organisms. The black plot indicates the existence of proteins homologous to human GTs. The colored bars indicate the categories of glycans synthesized by GTs. The branch length on the left shows the distance between GTs. The organisms are arranged in the order in which they are listed in the GTOP database. (B) Magnified view of the 195 eukaryotic organisms enclosed within a red line in (A). (C) Magnified view of the 62 metazoan organisms enclosed within a red line in (B). The blue bar denotes the human profile.

