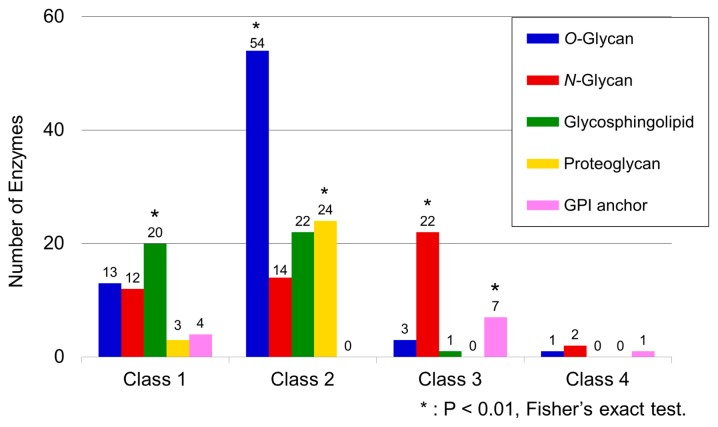
Figure 2.
Frequency distribution of GTs in each glycan type according to class. The numbers of GTs in each category of glycan synthesis are shown for each class. Class-specific glycan categories were assessed using Fisher’s exact test. Asterisks indicate categories that exceeded the numerical expectation value where P<0.01.

