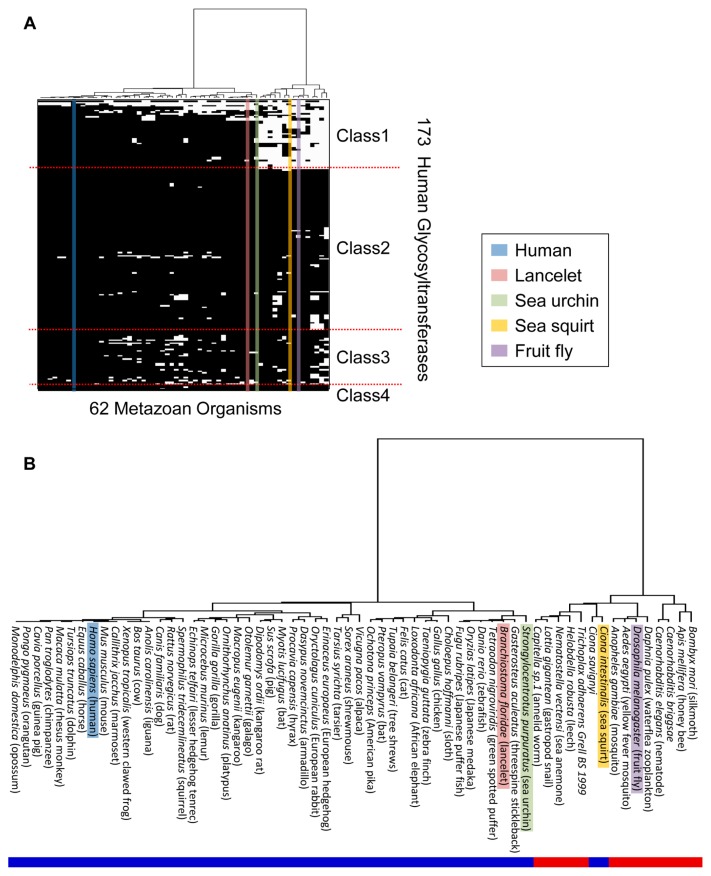
Figure 5.
Phylogenetic analysis of 62 organisms in metazoa. (A) Clustering analysis using Ward’s method based on the Manhattan distance. The five colors show conserved GTs in representative model organisms. The GTs listed on the vertical axis correspond to those listed on the vertical axis in Figure 1. (B) Magnified view of the phylogenetic tree in (A), as well as the corresponding names of the 62 organisms. The red and blue bars denote deuterostomes and protostomes, respectively.

