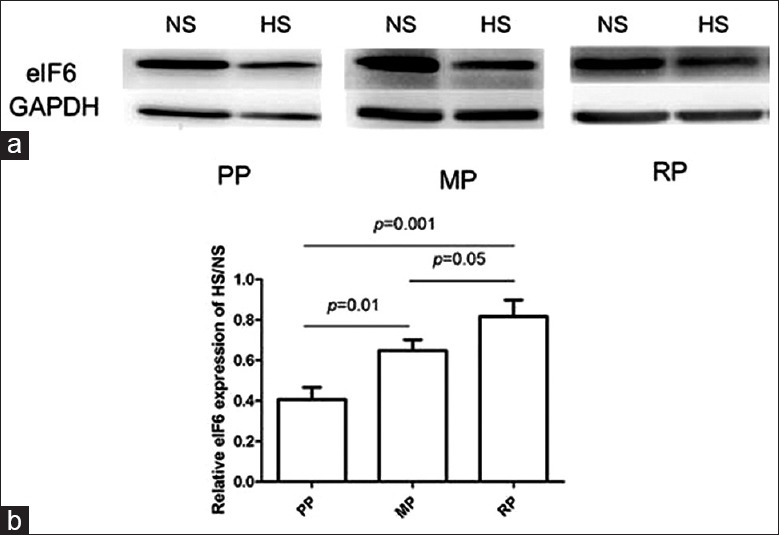
Figure 3.

The Western blot analysis of eukaryotic initiation factor 6 expression in hypertrophic scar and normal skin. (a) Western blot analysis of eukaryotic initiation factor 6 expression in normal skin and hypertrophic scar in proliferative phase, mature phase, and regressive phase. (b) Relative eukaryotic initiation factor 6 levels on Western blot analysis in normal skin and hypertrophic scar in proliferative phase, mature phase, and regressive phase. The data were presented as the mean ± standard deviation, and the statistic result was determined by one-way analysis of variance followed by Turkey multiple comparison. NS: Normal skin; HS: Hypertrophic scar; PP: Proliferative Phase; MP: Mature Phase; RP: Regressive Phase.
