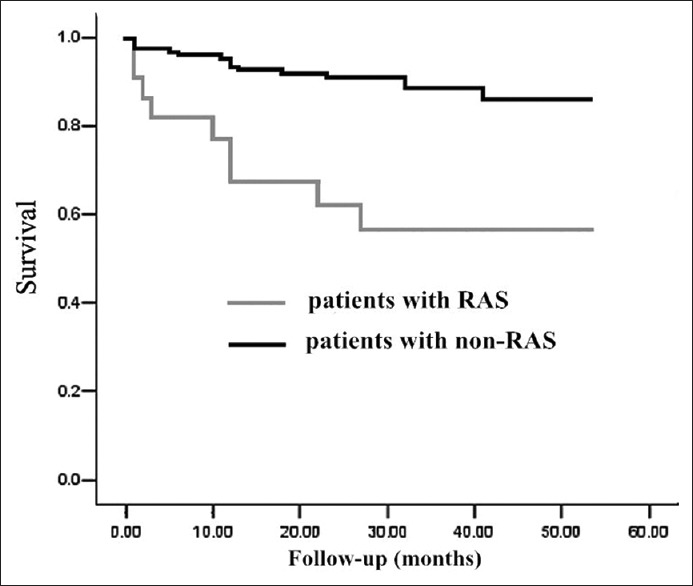
Figure 1.

Kaplan-Meier plot of the probability of freedom from all-cause mortality. Difference between patients with renal artery stenosis (RAS) or non-RAS was statistically significant by log-rank test (P < 0.01). Patients’ number corresponded to different time points was 121, 116, 110, 74, 35, 4 for non-RAS group and 22, 16, 13, 8, 5, 2 for RAS group.
