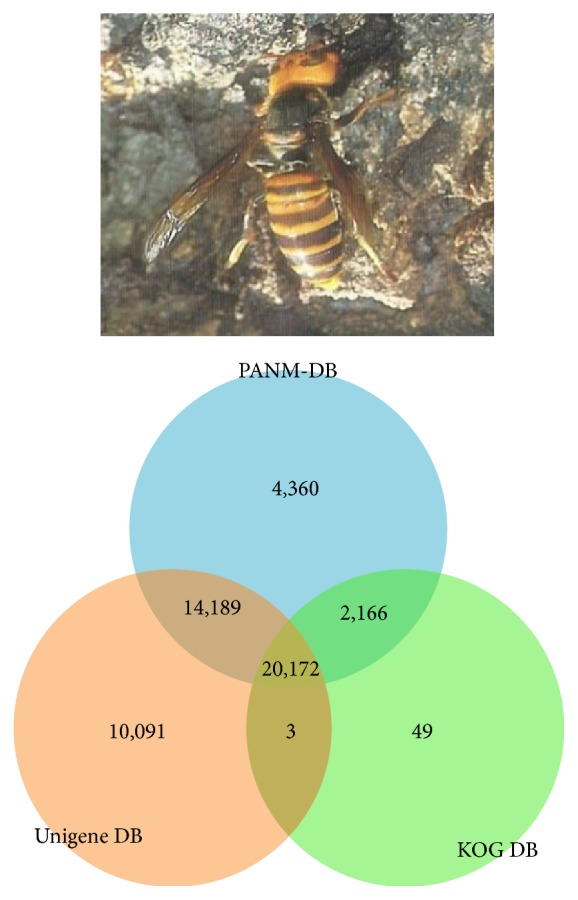
Figure 1.

Sequence annotation of unigenes obtained from V. mandarinia transcriptome assembly and clustering. A three-way Venn diagram plot shows the unique and overlapped transcripts from unigene annotation hits (BLASTX; E-value ≤ 1E − 5) against PANM-DB, Unigene, and KOG databases, respectively.
