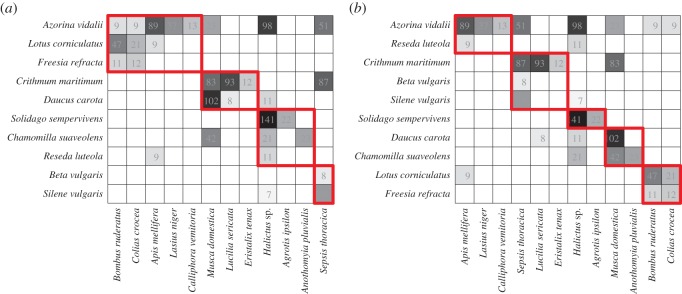
Figure 6.
A visual comparison of the modular structures identified for the olesen2002flores dataset of plant–pollinator visitations as a (a) binary (QB=0.444, four modules, QnormB=0.625) and (b) quantitative (QW=0.497 , five modules, ) network. Modulesare identified in red. The NMI shared between these two modular compositions is NMI=0.619 indicating a qualitative difference in the revealed modular structure.

