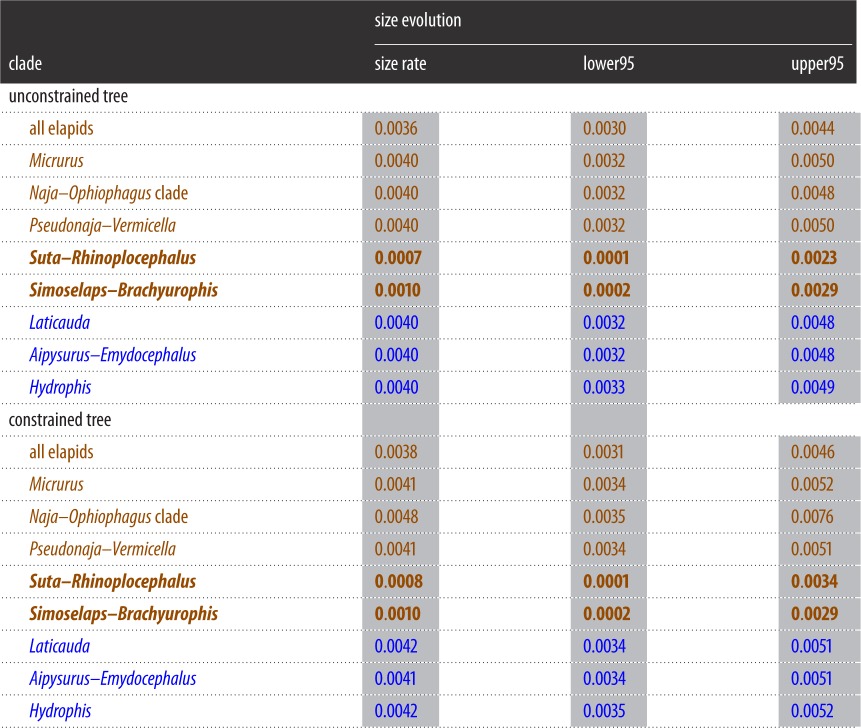
Table 2.
Rates of size evolution (average total length) for selected clades of elapids, as inferred using the best tree (figure 1) and the constrained tree (electronic supplementary material, figure S2). The mean and upper/lower 95% HPD for each estimate is presented. Bold denote clades with diversification regimes that were identified by BAMM as distinct from the elapid ‘background’: Suta–Rhinoplocephalus (‘Suta clade’) and Simoselaps–Brachyurophis (‘Simoselaps clade’) exhibit unusually slow rates. Note that Micrurus and Hydrophis (which have exceptionally fast diversification rates (table 1)) have unremarkable rates of size evolution. Brown, terrestrial taxa; blue, aquatic taxa.
 |
