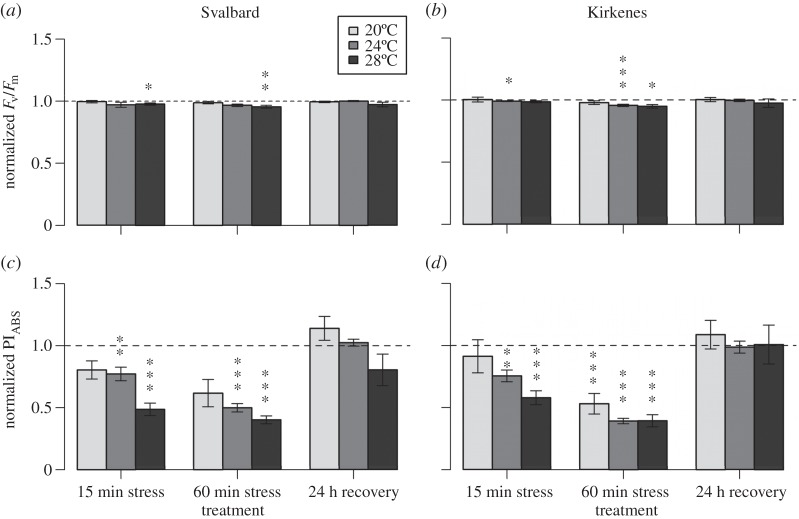
Figure 2.
Response of two populations of Fucus distichus to short-term thermal stress. The response was measured at three temperatures by maximum quantum yield (Fm/Fv) (a,b) and the performance index (PIABS) (c,d) for the Svalbard (a,c) and Kirkenes (b,d) populations. All values under treatment conditions (mean±s.e.) were normalized to values under control condition (control level =1). Significant differences between control values and values under treatment conditions are indicated by asterisks over treatment condition (*p<0.05, **p<0.01, ***p<0.001).

