
Figure 3.
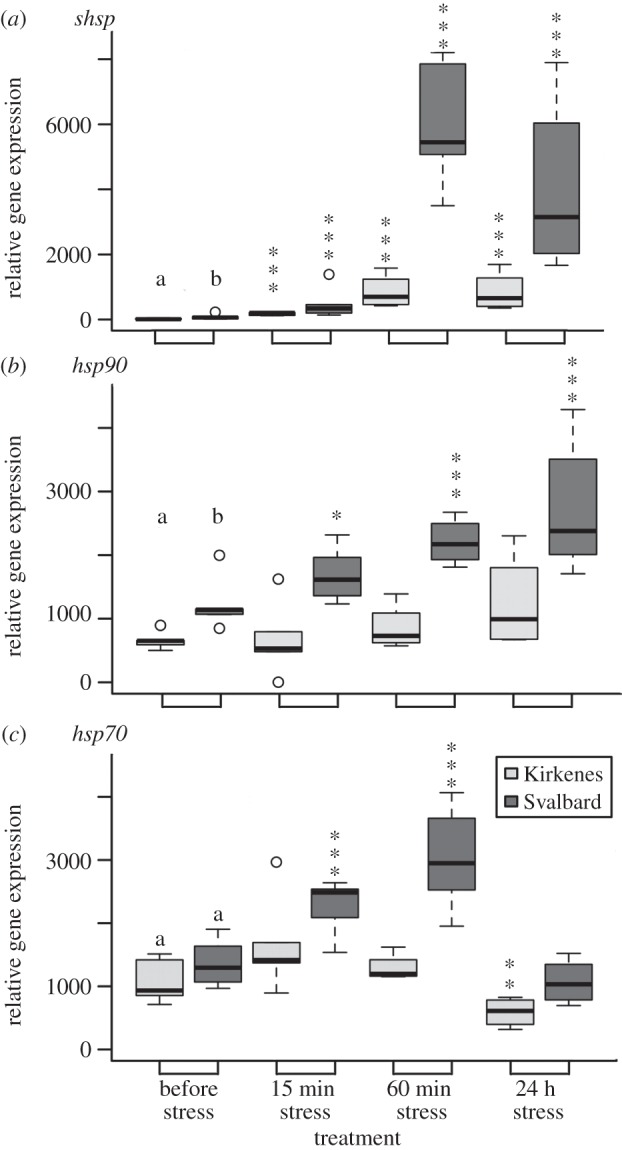
(a–c) Response of the two populations of Fucus distichus to short-term 24°C thermal stress in relative gene expression of hsp genes. Lower case letters (a,b) indicate significantly different expression levels (p<0.05) between the populations before stress (i.e. control conditions). Significant differences between control values and values under treatment conditions are indicated by asterisks over treatment condition (*p<0.05,**p<0.01,***p<0.001). Open circles are outliers.