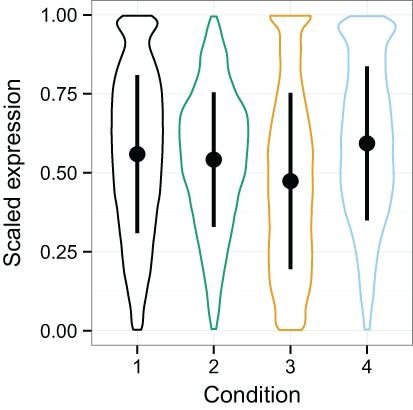
Figure 3. Violin plots of the simulated data distributions with standard deviation superimposed.

These plots show the distribution of expression values for the samples with each particular condition. Within and between class variability were created in the initial simulated dataset to create a challenging problem for normalization. This complication is amplified as noise is added.
