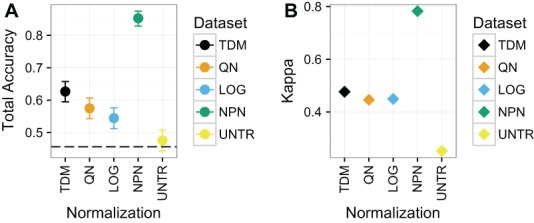
Figure 4. Results for Dataset 1.

(A) Mean total accuracy for BRCA subtype classification across ten iterations with 95% confidence intervals. Dashed line represents the “no information rate” that could be achieved by always picking the most common class. NPN had the highest mean total accuracy on these data, followed by TDM, then quantile normalization, and log2 transformation respectively. The untransformed RNA-seq data performed the worst. (B) Mean Kappa for BRCA subtype classification across ten iterations. NPN had the highest mean Kappa on these data, followed by TDM, which was then followed by quantile normalization and log2 transformation. The untransformed RNA-seq data performed the worst.
