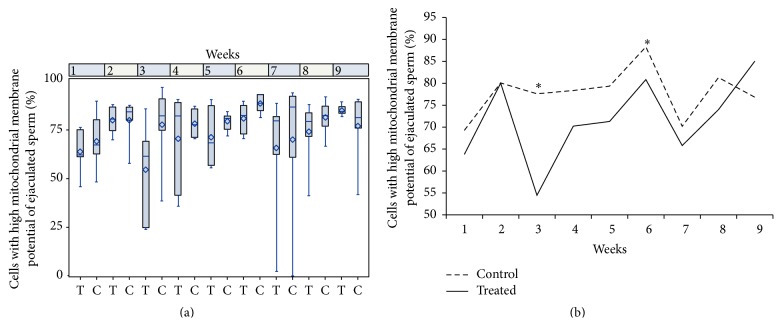
Figure 4.
Percentages of cells with high mitochondrial membrane potential of ejaculated sperm considering the interaction effect between treatment and week in rams submitted or not to heat stress. (a) Boxplot presented as median (superior quartile, inferior quartile). (b) Data presented as mean. Asterisk represents significant differences (p < 0.05). T: treated, C: control.

