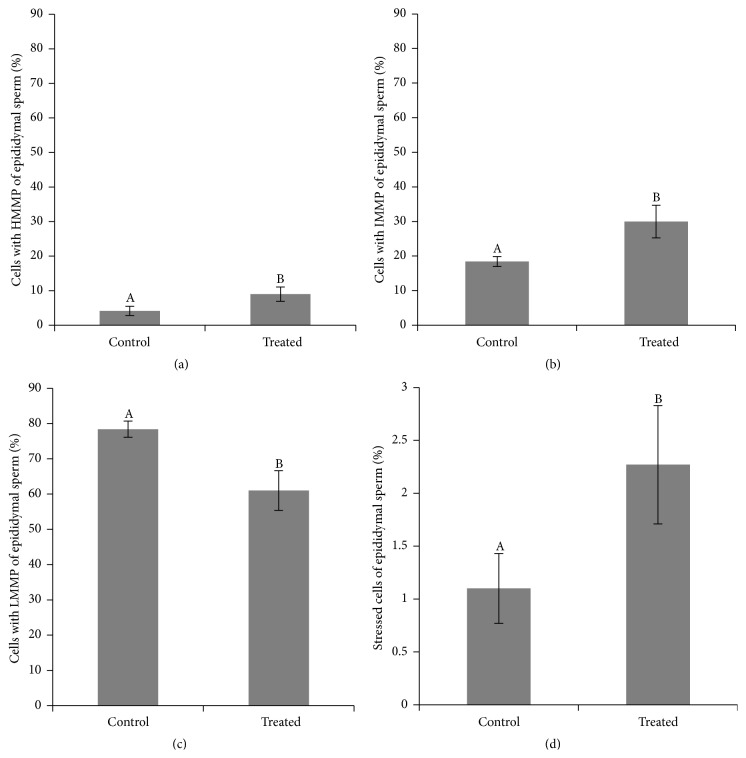
Figure 8.
Comparison of percentage of high, HMMP (a), intermediary, IMMP (b), low, LMMP (c), mitochondrial membrane potential and percentage of stressed cells (stained by dichlorofluorescein (d)) of epididymal sperm considering the treatment effect between treated and control groups in rams submitted or not to heat stress. Graphic presented as means ± SEM. Different superscript letters in each bar represent significant differences (p < 0.05).

