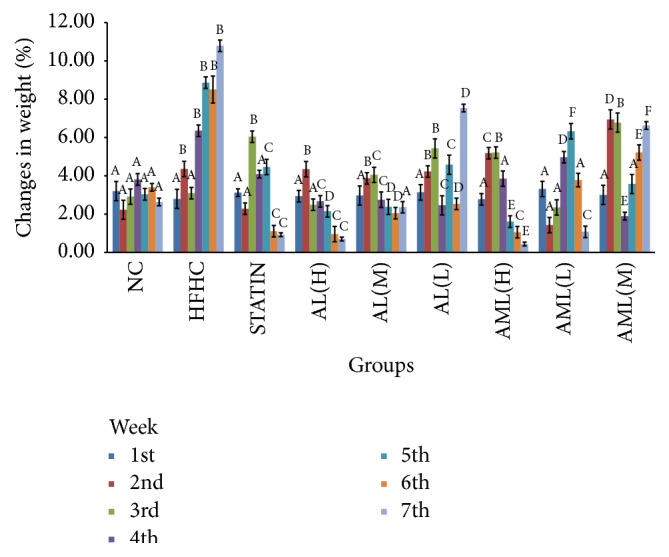
Figure 6.

Weekly body weight changes in high fat and high cholesterol fed rats after 7 weeks of intervention. Values are means ± SD (n = 7). Bars representing weekly mean weights labelled with different letters (A–F) are significantly different between the groups (p < 0.05) according to Duncan's multiple range test. Groups are the same as Figure 5.
