Figure 4.

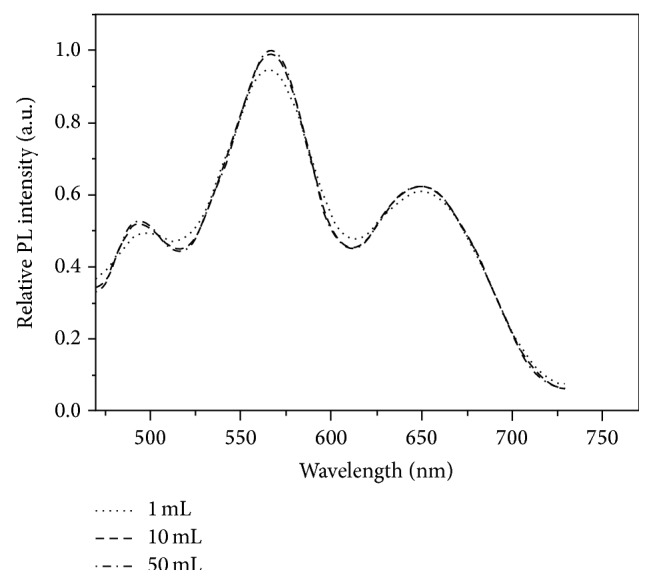
The fluorescence spectra of the hybridization complex separated from above 1 (dotted line), 10 (dashed line), and 50 (dotted and dashed line) mL solutions.

The fluorescence spectra of the hybridization complex separated from above 1 (dotted line), 10 (dashed line), and 50 (dotted and dashed line) mL solutions.