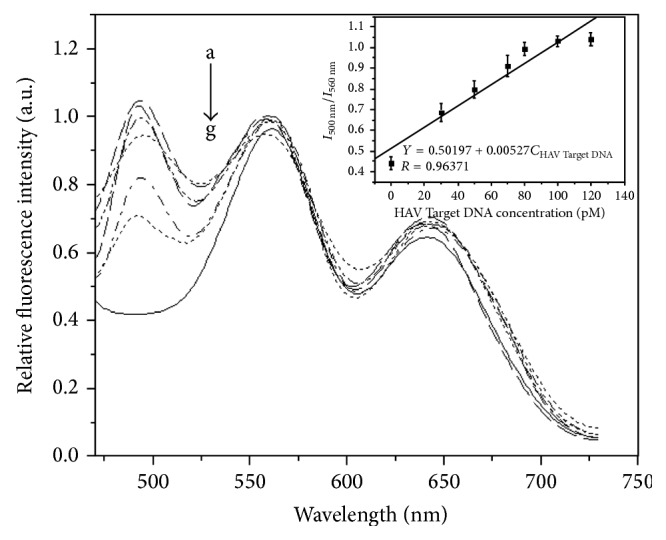
Figure 6.

Fluorescence emission spectra of hybridization complex with a series of different concentrations of HAV Target DNA added (a–g: 0 pM, 30 pM, 50 pM, 70 pM, 80 pM, 100 pM, and 120 pM). The inset shows the relationship between relative fluorescent intensity of I 500 nm/I 560 nm after immunoreaction and the concentration of HAV Target DNA.
