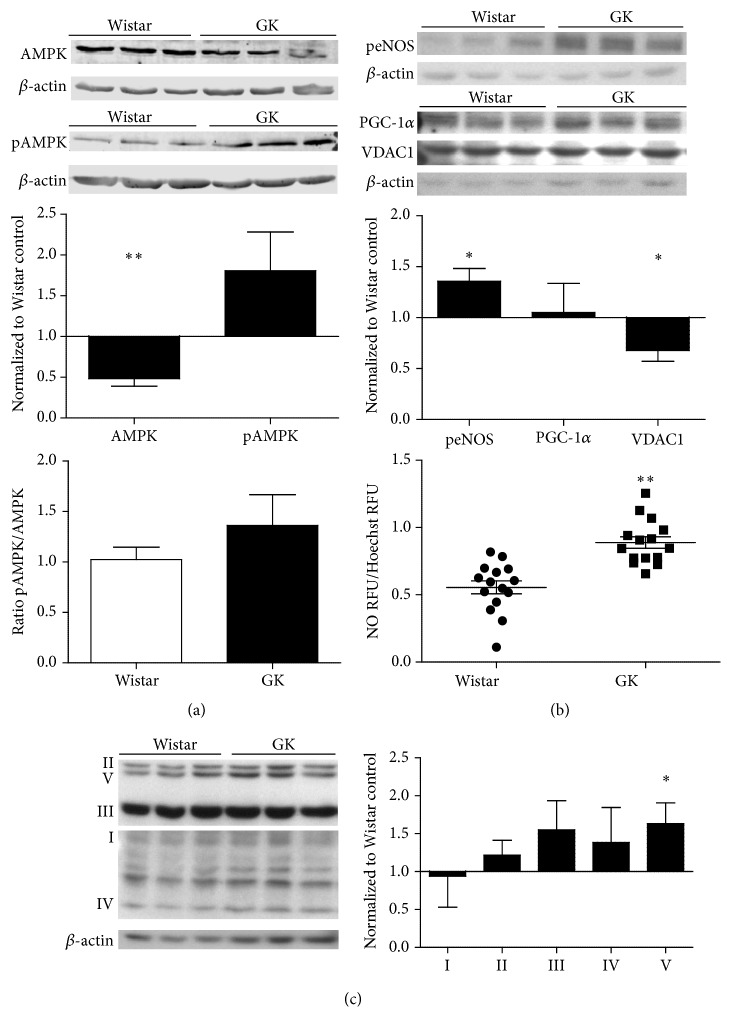
Figure 2.
(a) Baseline comparisons of AMPK (n = 3), pAMPK (n = 3), and AMPK specific activity (pAMPK/AMPK), signaling upstream of mitochondria (n = 3) and resultant NO evolution (n = 4) (b), and mitochondrial complex differences (n = 3) (c) in Wistar and GK SMCs, passages 8–10. Signaling protein expression was measured with Western blot, 15–30 μg protein on an SDS-page gel, and data are normalized to β-actin and expressed as mean fold change from Wistar SMCs + SEM. Significance measured by Student's t-test, ∗ p < 0.05. NO (n = 3) is expressed as relative fluorescence units (RFU) normalized to RFU of Hoechst live cell staining for cell number. ∗ p < 0.05, ∗∗ p < 0.01 as measured by Student's t-test.

