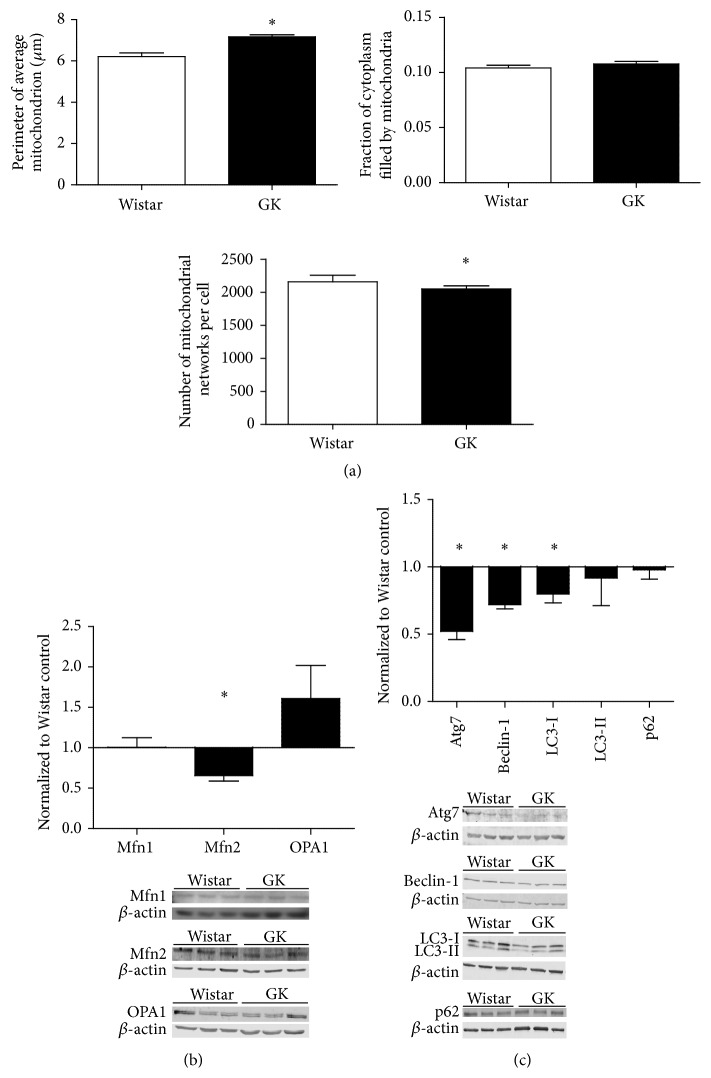
Figure 4.
(a) Assessment of baseline mitochondrial morphology. Baseline perimeter per mitochondrion, total mitochondria fill of cytoplasm, and number of mitochondrial networks per cell were measured in fixed Wistar (n = 3) and GK (n = 3) SMCs using TOM 20 (mitochondria) and nitrotyrosine (cytoplasm). (b) Baseline comparison of mitochondrial dynamics and autophagy regulators (c) in Wistar (n = 3) and GK (n = 3) SMCs, passages 8–10. Signaling protein expression was measured with Western blot, 15–30 μg protein on an SDS-page gel, and data are normalized to β-actin and expressed as mean fold change from Wistar cells + SEM. Significance measured by Student's t-test, ∗ p < 0.05.

