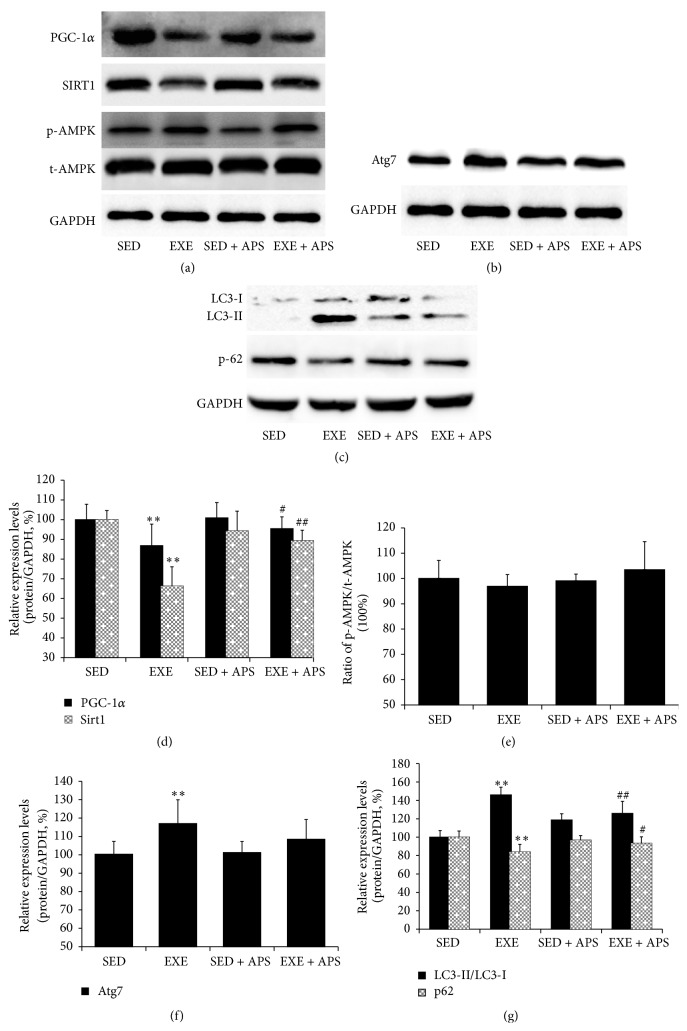
Figure 4.
Effects of APS on mitochondrial biogenesis and autophagy activation in vivo. ((a), (d), (e)) Protein levels of PGC-1α, Sirt1, and AMPK ((a) Western blot images; (d), (e) statistical results); ((b), (f)) protein levels of Atg7 ((b) Western blot images; (f) statistical results); ((c), (g)) protein levels of LC3-I, LC3-II, and p62 ((c) Western blot images; (g) statistical results). Values are means ± SEM; ∗∗ P < 0.01 versus SED group; # P < 0.05 versus EXE group; ## P < 0.01 versus EXE group.

