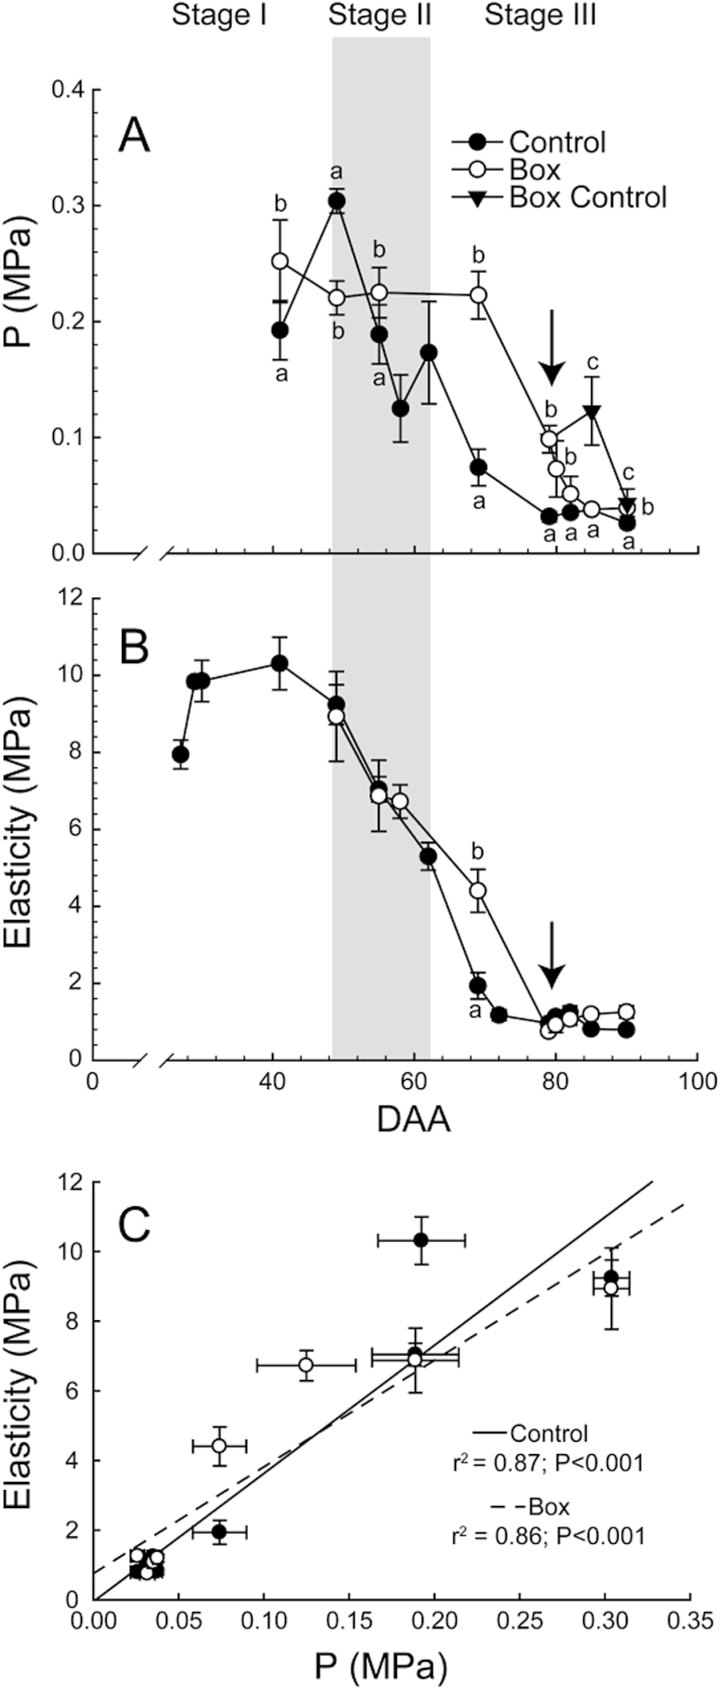
Fig. 2.
Cell turgor (P) and berry elasticity. (A) Cell turgor through berry development in Control, Box, and Box Control (n = 12–42). (B) Elasticity in Control and Box berries (n = 16). Boxes were removed at 79 DAA (arrow) and Box Control remained boxed on the cluster. Bars represent ± SE and different letters signify significant differences (Tukey’s HSD, P < 0.05). (C) Relationship between elasticity and cell turgor. Points are means of 2–6 berries and bars are ±SE.

