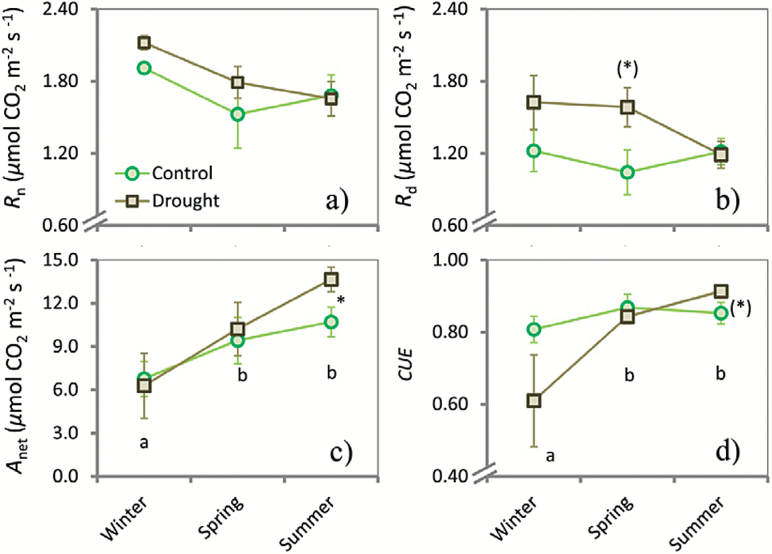
Fig. 2.
Line graphs depicting seasonal changes of night respiration (R n) (a), day respiration (R d) (b), net assimilation rate (A net) (c), and (d) carbon-use efficiency (CUE i) (d) for Q. ilex. Seasonal campaigns were conducted in winter, spring, and summer 2013. Asterisks and asterisks in brackets indicate significant (P<0.05) and marginally significant (P<0.1) differences between the control and drought plots for each season, respectively. Different lower-case letters indicate differences between seasons. Vertical bars indicate standard errors of the mean (n=59).

