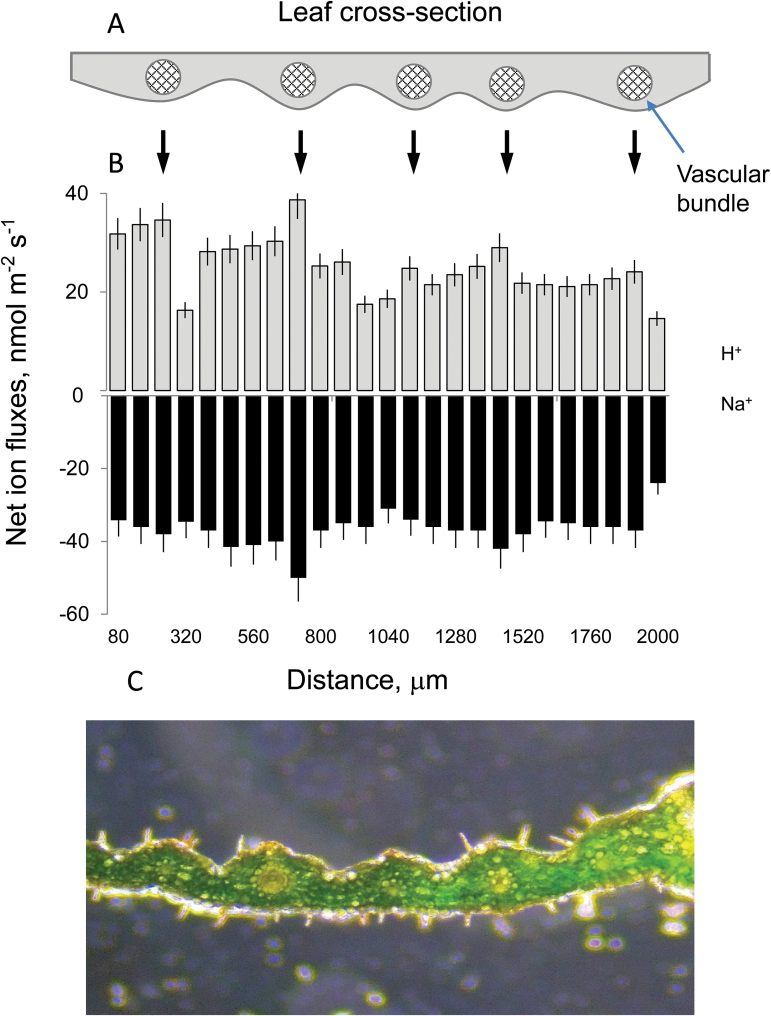
Fig. 4.
Ion flux profiles along the cross-section of wheat leaf. (A) Schematic model depicting the position of major veins in a wheat leaf. (B) Net H+ (grey bars) and Na+ (black bars) fluxes measured at different parts of the leaf (see panel A) from control plants to assess the leaf profile. Mean ±SE (n=4 individual leaves). (C) A microscopic image depicting a cross-section of a wheat leaf.

