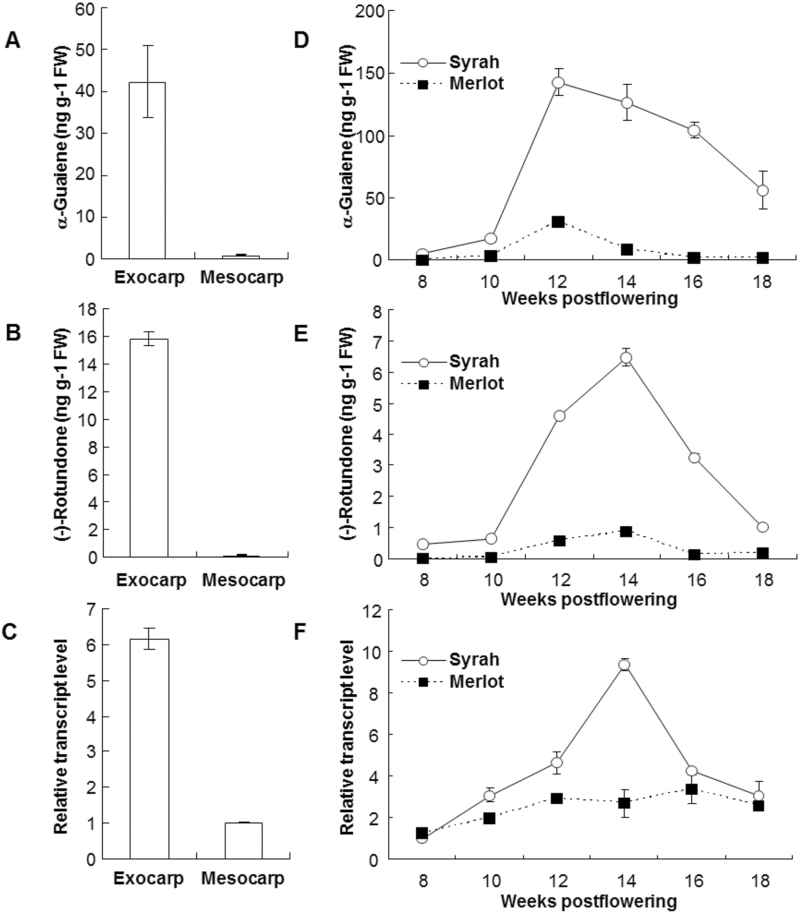
Fig. 5.
Patterns of α-guaiene and (−)-rotundone accumulation with relative transcript levels of VvSTO2 mRNA in grape berries. (A) Concentration of α-guaiene, (B) concentration of (−)-rotundone and (C) relative transcript levels of VvSTO2 mRNA in each tissue of Syrah grape berries. (D) Concentration of α-guaiene, (E) concentration of (−)-rotundone and (F) relative transcript levels of VvSTO2 mRNA in Syrah and Merlot grape exocarp during grape maturation after flowering. The transcipt levels of VvSTO2 mRNA were determined by the quantitative real-time RT-PCR. All samples were normalized using 18 rRNA as an internal control. The transcript levels in the mesocarp for the experiment in panel C and in the Syrah grape exocarp at 8 weeks postflowering for the experiment in panel F were set to 1 to calculate the relative transcript levels of VvSTO2 mRNA, respectively. Values are the mean ± standard deviation of three technical replicates. FW, fresh weight.

