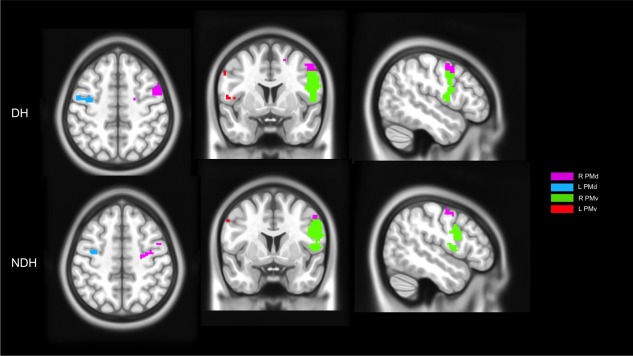
Figure 2.

Illustration of activations of main effect of movement within the dorsal (PMd) and ventral (PMv) premotor cortex when using either DH or NDH. These maps were generated by masking significant activations (using a threshold of P < 0.001, corrected at the cluster level, for the purpose of illustration) with ROIs localized in the premotor regions using the HMAT template. In the map right is right. [Color figure can be viewed in the online issue, which is available at http://wileyonlinelibrary.com.]
