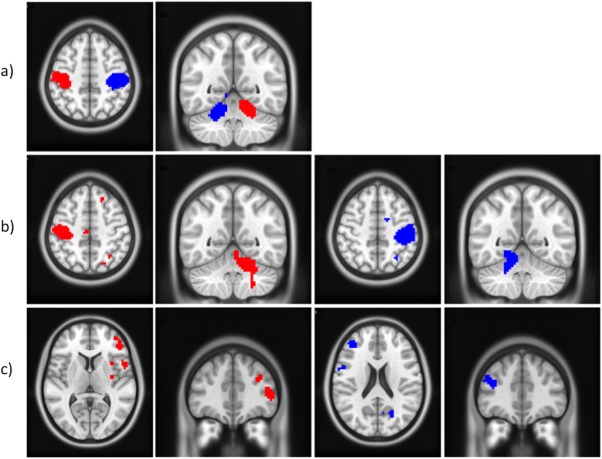
Figure 6.

Paired t test analyses at the group level and 60% GF level to compare the DH (red) with NDH (blue), or fNDH (blue). (a) Specificity of regions (by comparing DH and NDH); (b) Lateralisation of regions by comparing DH or NDH versus their flipped images; c) Strength of activations by comparing DH and fNDH. All clusters are corrected for multiple comparisons after using a threshold of 0.001 (uncorrected) at the voxel level. In the images, right is right and left is left. [Color figure can be viewed in the online issue, which is available at http://wileyonlinelibrary.com.]
