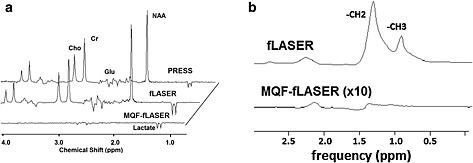
Figure 2.

(a) PRESS, fLASER and MQF‐fLASER spectra from solution of brain metabolites (12.5 mM N‐acetyl aspartate (NAA), 10 mM creatine (Cr), 3 mM choline (Cho), 7.5 mM myo‐inositol, 12.5 mM glutamate (Glu), 5 mM lactate). (2 cm)3 voxel, 128 acquisitions, T R 1000 ms, T E 144 ms. Data were zero filled from 2048 to 4096 points, and apodized with 1 Hz line broadening. Note that while the amplitudes of the singlets (e.g. creatine) are similar in PRESS and fLASER spectra, the lactate signal is substantially larger in the fLASER spectrum as it does not suffer significant signal loss from the chemical shift displacement artefact effect. In these spectra the MQF‐fLASER lactate peak is 46% of that in the fLASER (i.e. nearly the theoretical maximum), and is also larger than that in the PRESS spectrum. (b) fLASER and MQF‐fLASER spectra of safflower oil. (2 cm)3 voxel, T R = 1000 ms, T E = 144 ms, NSA = 128 (fLASER) and 256 (MQF‐fLASER). The MQF‐fLASER spectrum is displayed after a ×10 vertical expansion. Note the almost total suppression of the lipid resonance at 1.3 ppm.
