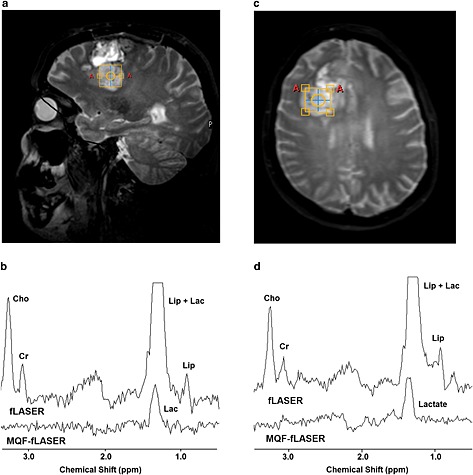
Figure 3.

fLASER and MQF‐fLASER spectra of high‐grade brain tumours (glioblastoma multiforme). (a) Voxel location shown on sagittal T 1‐weighted image (T R/T E = 11/4.6 ms). (b) Corresponding fLASER and MQF‐fLASER spectra. Cho, choline; Cr, creatine; Lip, lipid; Lac, lactate. Water linewidth 6.0 Hz. (c) Voxel location shown on transverse T 2‐weighted image (T R/T E = 2500/229 ms). (d) Corresponding fLASER and MQF‐fLASER spectra, water linewidth 6.7 Hz. All spectra were acquired using T R 1000 ms, T E 144 ms, NSA 128 (fLASER) and 256 (MQF‐fLASER), and voxel size (2 cm)3.
