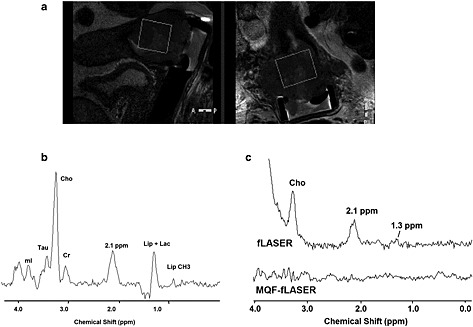
Figure 5.

Example fLASER spectra from cervical tumours. (a) Voxel location shown on sagittal and coronal T 2‐weighted images of Stage 2b cervical squamous cell carcinoma (T R/T E = 2750/80 ms). (b) Corresponding fLASER spectrum. mI, myo‐inositol; Tau, taurine; Cho, choline; Cr, creatine; Lip, lipid; Lac, lactate. Voxel size 10 cm3, T R 1320 ms, T E 144 ms, NSA 128, water linewidth 10 Hz. (c) Example fLASER and MQF‐fLASER spectra from Stage 2b poorly differentiated squamous cell carcinoma. Note the very low levels of both lipid and lactate at 1.3 ppm in the fLASER spectrum, and the absence of any significant signals (including lactate) in the MQF‐fLASER spectrum. Voxel 3.8 cm3, T R = 1346 ms, T E = 144 ms, NSA = 128 (fLASER), 256 (MQF‐fLASER), water line width 18 Hz.
