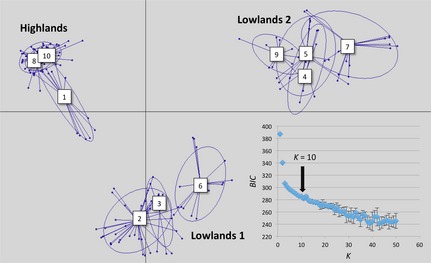
Figure 2.

Nuclear genetic clustering among 199 sylvatic Bolivian TcI clones. Multidimensional scaling plot based on discriminant analysis of principal component (DAPC) analysis for 10 clusters defined via K‐means clustering algorithm (109 iterations, three principal components representing 80% of total variation in the data set). Bayesian information criterion (BIC) curve is inserted with error bars representing the standard deviation about the mean of five independent runs. Inertia ellipses correspond to the optimal (as defined by the BIC minimum) number of population clusters among the genotypes analysed. Individual clones are indicated by dots. The 10 DAPC clusters are separated into three genetically distinct groups: highlands (clusters 1, 8 and 10), lowlands 1 (clusters 2, 3 and 6) and lowlands 2 (clusters 4, 5, 7 and 9).
