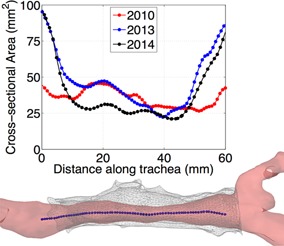
Figure 2.

Cross‐sectional variation in area along the length of the trachea as derived from each scan. Both the more recent measurements demonstrate growth at either end of the transplanted section, whereas the 2010 measurements are more constant along the length. The minimum area has reduced by 20.5% between 2010 and 2014, while the area has more than doubled at the extremities. Below the area plot you can see a reconstruction of the 2013 geometry and stent with the centerline highlighted.
