
Figure 3.
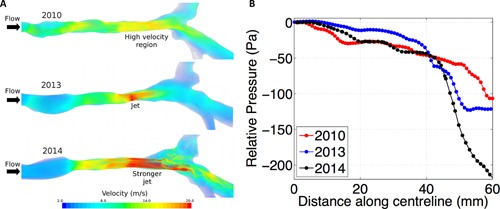
(A) Flow velocities. The velocity in the 2010 geometry is relatively uniform, similar to that of a healthy/normal individual in the upper region, while somewhat accelerated in the lower part. By 2013, a constriction is apparent which leads to the formation of a jet in that area. A longer constriction is seen in 2014 geometry which causes higher velocities in the upper region and a stronger jet below necessitating intervention with balloon dilatation. (B) Relative pressure. Here, we see relative pressure plotted along the distance of the centerline. 2013 shows an abrupt drop in pressure at the location of the jet, which then plateaus, to a pressure drop slightly higher than that in 2010. The long constriction and strong jet in 2014 results in double the pressure drop when compared to the 2010 geometry.