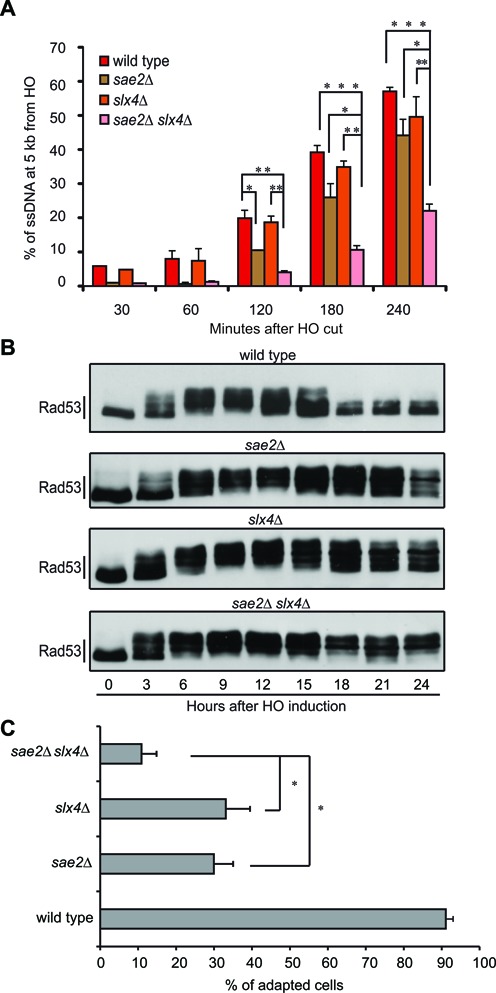
Figure 4.

Deletion of SLX4 exacerbates sae2Δ cells phenotypes. (A) DSB resection analysis by qPCR in nocodazole-arrested JKM179 derivative strains. Plotted values are the mean of at least two independent experiments ±SEM. Where indicated, significance was determined by single-tailed Student's t test (*for P < 0.05, ** for P < 0.01 and *** for P < 0.001). (B) Rad53 phosphorylation analysis by Western Blot in JKM179 derivative strains after HO induction. (C) Graph shows the percentage of adapted cells for each mutant 24 h after plating on galactose containing medium. Values are the mean of three independent experiments ± standard deviation. Where indicated, significance was determined by double-tailed Student's t test (* for P < 0.05).
