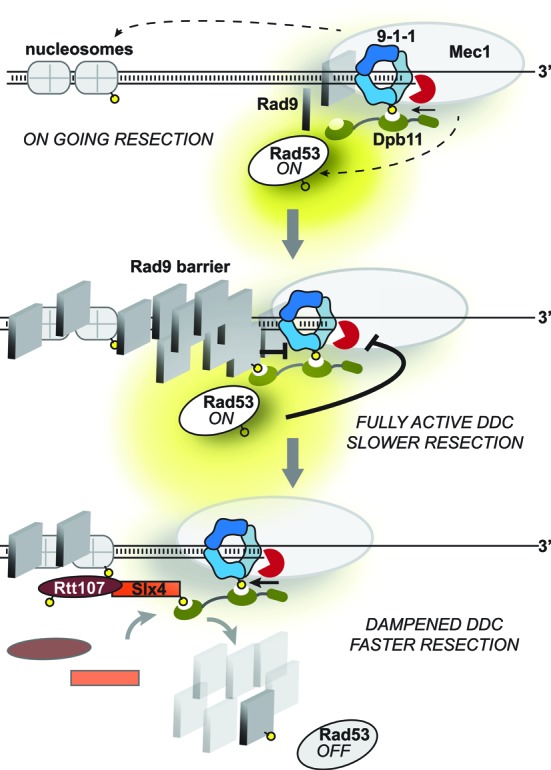
Figure 7.

A model for the interplay between Rad9 and the Slx4-Rtt107 complex at a DSB. See text for the details. Yellow circles indicate phosphorylation events.

A model for the interplay between Rad9 and the Slx4-Rtt107 complex at a DSB. See text for the details. Yellow circles indicate phosphorylation events.