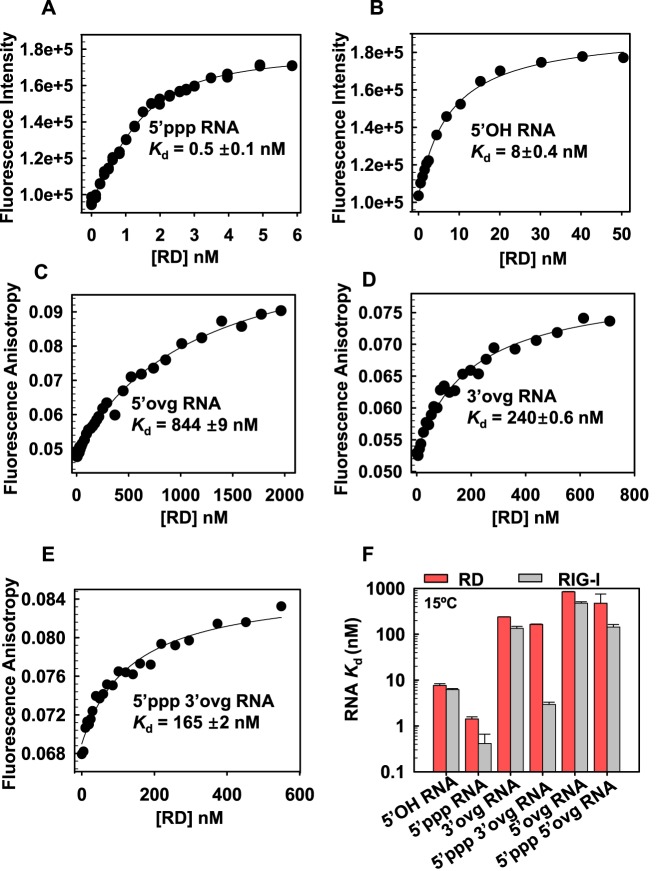
Figure 3.
Kd values of the C-terminal RIG-I RD complexes with blunt-end and non-blunt ended dsRNAs. (A–B) Fluorescence intensity of 3′ fluorescein labeled dsRNA with 5′ppp or 5′OH (2 nM) was measured after addition of increasing concentration of the RD protein. The data were fit to Equation (3) to obtain the dissociation constant (Kd) values. (C–E) Fluorescence anisotropy of 5′ fluorescein labeled overhang dsRNAs (40 nM) was measured with increasing concentrations of RD and data were fit to Equations (1) and (2) to obtain the Kd values. (F) The bar chart compares the Kd values of RD and RIG-I complexes with the indicated RNAs. Standard errors from fitting are shown.

