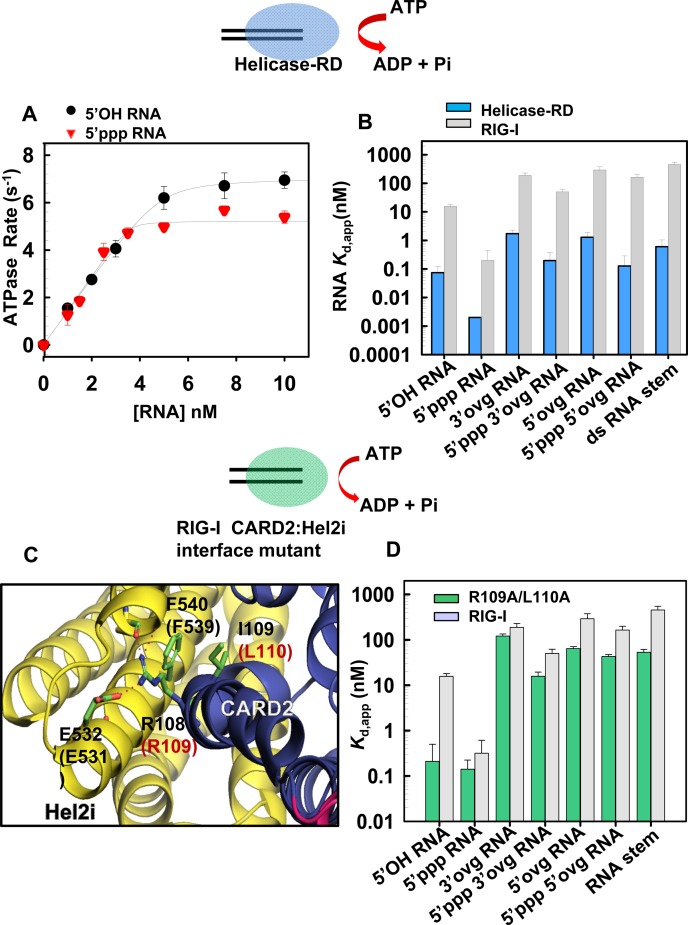
Figure 4.
Loss of RNA binding selectivity upon removal of CARDs or mutation in the CARD2-Hel2i interface. (A) Helicase-RD (5 nM) was titrated with increasing concentrations of 5′OH RNA (black circles) or 5′ppp RNA (red inverted triangles) and the ATPase turnover rates were measured at 15°C in Buffer A. The binding curves show stoichiometric 1:1 binding of Helicase-RD and RNA. (B) Bar Chart compares the apparent dissociation constant Kd,app of Helicase-RD (blue bars) for the various RNAs are shown in comparison to RIG-I (gray bars). The Kd of Helicase-RD for 5′ppp RNA was determined from the off and on rates. Standard errors from the fitting are shown. (C) The CARD2 (blue) and Hel2i (yellow) interface residues in duck RIG-I and the corresponding residues inhuman RIG-I (in parentheses) are shown. CARD2 residues R109 and L110 interact with Hel2i residues E531 and F539, respectively. (D) Bar Chart compares the Kd,app values of R109A/L110A RIG-I (green bars) complexes with indicated RNAs are shown in comparison to RIG-I (gray bars). Standard errors from fitting are shown (also see Supplementary Table S3).

